Book 5. Risk and Investment Management
FRM Part 2
IM 15. Market-Driven Scenarios: An approach for Plausible Scenario Construction
Presented by: Sudhanshu
Module 1. Market- Driven Scenario Framework And Statistical Tools
Module 2. Building and Implementing Market-Driven Scenarios
Module 1. Market-Driven Scenario Framework And Statistical Tools

Topic 1. Market-Driven Scenario Approach
Topic 2. Conditional Stress Testing Framework
Topic 3. Mahalanobis Distance and Scenario Z-Score
Topic 4. Volatility Z-Score
Topic 5. Correlation Z-Score
Topic 6. Correlation Z-Score
Topic 7. Covariance Matrix Selection
Topic 1. Market-Driven Scenario Approach
- Pre-GFC Limitations: Traditional stress testing relied on VaR and tracking-error models with model-consistent tests heavily dependent on historical data; the Global Financial Crisis exposed this weakness when historical relationships between key market variables broke down completely
- Scenario Analysis Emergence: Provides forward-looking event estimation as an alternative to historical-data-dependent models, though it historically lacked an established construction framework
- Foundation in Wisdom of Crowds: MDS framework applies Surowiecki's three criteria for improved collective decision-making:
- Each individual possesses specialized knowledge unavailable to others
- Individual opinions remain independent, avoiding groupthink
- Objective mechanism aggregates private views into collective assessment
- MDS Structured Process: Risk management department develops centralized process gathering input from diverse investment professionals across asset classes, regions, and expertise areas, then aggregates ideas into collective view meeting Surowiecki's criteria
Topic 1. Market-Driven Scenario Approach
- Scenario Development Workflow: Risk managers, investors, and economists identify current issues (inflation, trade policy, monetary policy); define idealized outcomes covering plausible possibilities; translate outcomes into instantaneous shocks on policy variables (equity, bond, commodity indices)
- Refinement and Validation: Mahalanobis distance measure assesses plausibility and magnitude of each shock; shocks pass through covariance matrix for plausibility review; multiple iterations refine scenario until collective agreement; finalized shocks enter valuation engine to produce P&L identifying key risk drivers
- Value of Structured Subjectivity: Despite subjective elements, MDS requires risk takers to quantify views through structured process, enabling transparent challenge and refinement through iterative feedback essential for effective portfolio risk management
Practice Questions: Q1
Q1. Which of the following statements best describes the key advantage of the market-driven scenario (MDS) approach compared with traditional stress testing methods used before the Global Financial Crisis (GFC) of 2007–2009? The MDS approach:
A. removes subjectivity entirely by relying on fully automated statistical models.
B. relies solely on historical relationships between market variables to estimate P&L impacts.
C. eliminates the need for covariance matrices by focusing only on individual asset-level shocks.
D. provides a structured framework for aggregating diverse expert opinions into forward-looking scenarios.
Practice Questions: Q1 Answer
Explanation: D is correct.
The MDS approach collects forward-looking views from a diverse group of investment professionals and aggregates them using a structured framework that incorporates statistical constraints (e.g., covariance matrices). Although subjectivity remains, the MDS process channels it in a disciplined and transparent way, improving the plausibility and usefulness of scenario analysis compared with traditional pre-GFC methods that depended heavily on historical data relationships.
-
The MDS approach functions as a conditional stress testing framework.
-
Conditional Stress Testing Approach: MDS functions as a conditional stress testing framework where a total set of M risk factors are influenced by shocks applied to a smaller subset of K policy risk drivers
- Policy Variable Selection: Policy variables are typically major traded instruments that serve as primary shock drivers
- Examples include S&P 500 Index, bond yields, or factor-mimicking portfolios (momentum, growth factors)
- Keeping policy variables small minimizes arbitrariness in the resulting perturbation vector
-
Topic 2. Conditional Stress Testing Framework
r_j
r_j=\sum_{k=1}^K \beta_{j, k} r_k+\varepsilon_j \text { for } j=K+1, K+2, \ldots, M, \text{ where }
\beta_{\mathrm{j}, \mathrm{k}}=\text { beta of factor } j \text { to policy factor } k
- Beta Coefficient Estimation: Estimating β coefficients is equivalent to estimating the covariance matrix of the M factor returns
- Portfolio P&L Calculation: Once the full perturbation vector is obtained from regression, portfolio profit and loss can be calculated based on factor exposures
- Return Estimation Formula: Assuming linear asset returns in risk factor shocks, portfolio return can be estimated under specified policy and nonpolicy (implied) variable shocks
-
Positions with embedded optionality, which exhibit nonlinear payoffs, are typically fully revalued using the full perturbation vector of factor shocks.
Topic 2. Conditional Stress Testing Framework
\begin{aligned}
&\begin{aligned}
\tilde{\mathrm{R}}_{\text {portfolio }} & =\mathrm{R}_{\text {policy }}+\tilde{\mathrm{R}}_{\text {implied }} \\
& =\sum_{\mathrm{k}=1}^{\mathrm{K}} \mathrm{~L}_{\mathrm{k}} \mathrm{~S}_{\mathrm{k}}+\sum_{\mathrm{j}=\mathrm{K}+1}^{\mathrm{M}} \mathrm{~L}_{\mathrm{j}} \mathrm{~S}_{\mathrm{j}} \\
& =\sum_{\mathrm{k}=1}^{\mathrm{K}} \mathrm{~L}_{\mathrm{k}} \mathrm{~S}_{\mathrm{k}}+\sum_{\mathrm{j}=\mathrm{K}+1}^{\mathrm{M}} \mathrm{~L}_{\mathrm{j}} \sum_{\mathrm{k}=1}^{\mathrm{K}} \tilde{\beta}_{\mathrm{j}, \mathrm{k}} \mathrm{~S}_{\mathrm{k}}
\end{aligned}\\
&\text {where: }\\
&\begin{aligned}
& \mathrm{L}_{\mathrm{k}}=\text { portfolio loading for factor } k \\
& \mathrm{S}_{\mathrm{k}}=\text { shock to factor } k
\end{aligned}
\end{aligned}
- Objective Evaluation Need: When experts propose a vector of policy variable shocks (r) in the MDS approach, an objective method is needed to assess whether these shocks are plausible or inconsistent with historical patterns
- Implausible Shock Identification: Shocks with high MD values are considered outliers and highly inconsistent with historical data, flagging them as potentially unrealistic scenarios
- Mahalanobis Distance (MD) Method: The most common statistical technique for identifying multivariate outliers; measures how many standard deviations a data point is from the center of a distribution while accounting for correlations among variables and the shape of the data
- Conceptual Foundation: MD is essentially a multivariate generalization of a z-score, extending the univariate outlier detection concept to multiple correlated dimensions
-
Topic 3. Mahalanobis Distance
\begin{aligned}
\operatorname{MD}(r, \Sigma)&=\sqrt{(r-\mu)^T \Sigma^{-1}(r-\mu)}\\
\text{where}:&\\
\mathrm{r}&= \text{shock vector}\\
\mu&= \text{mean vector}\\
\Sigma^{-1}&= \text{inverse covariance matrix of policy variables}\\
\end{aligned}
- Stable Risk Measure: Prevents the Mahalanobis Distance (MD) from increasing at a rate proportional to the square root of the number of policy variables (n), providing a more stable risk measure
- Definition: Represents the severity of a given scenario measured in standard deviations
-
- Application in Scenario Comparison: When comparing multiple scenarios, the scenario with the lower z-score is considered more plausible or likely to occur
- Purpose of Scenario Z-Scores: Designed to measure the relative probability of events under the assumption that asset returns follow an elliptical distribution
- Probability Conversion Requirement: Additional assumptions are needed to convert scenario z-scores into absolute probabilities
- Parametric Approach: Assumes a specific probability distribution for the z-scores to derive absolute probability estimates
- Nonparametric Approach: Estimates an empirical distribution of z-scores based on historical data over a defined time horizon
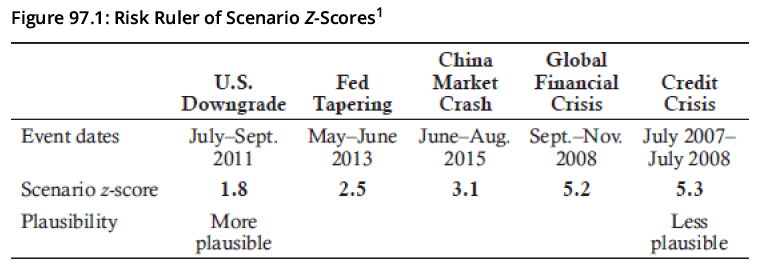
- Risk Ruler Concept: A spectrum of historical events arranged from most plausible to least plausible, used to scale hypothetical future events by comparing them with past outliers
Topic 4. Scenario Z-Score
\mathrm{Z}(\mathrm{r}, \Sigma)=\frac{\mathrm{MD}(\mathrm{r}, \Sigma)}{\sqrt{\mathrm{n}}}
- Methodology: Analysts match the perceived likelihood of a hypothetical future event to historical events on the risk ruler
- Historical events are listed with associated scenario z-scores (standard deviations) based on a selected covariance matrix
- Lower z-scores represent more plausible events that were closer to normal market conditions
- Application: Helps determine appropriate scenario z-scores for stress testing
- Higher z-scores indicate more severe or less plausible market stresses
- Enables consistent scaling of scenarios based on historical precedent
- Subjective Calibration: Allows analysts to leverage past market disruptions (even those that seemed implausible beforehand) as benchmarks for sizing potential future stress events
Topic 4. Scenario Z-Score
- Two-Component Decomposition: Kinlaw and Turkington (2014) propose breaking down the scenario z-score into two distinct components for better risk analysis:
- Magnitude Component (Volatility Z-Score)
- Consistency Component
- Magnitude Component (Volatility Z-Score): Isolates the size of market shocks by calculating the scenario z-score under the assumption that all correlations between shocks are zero
- Consistency Component: Captures how well the scenario shocks align with the chosen covariance structure
Topic 5. Volatility Z-Score
V(z)=\sqrt{\frac{z^T z}{n}}
- Purpose: This combined measure allows risk managers to assess portfolio stress performance relative to both scenario outcomes and market volatility levels, providing a more comprehensive risk evaluation
- Normalization for Shock Magnitude: The correlation z-score normalizes the scenario z-score by adjusting for the magnitude of market shocks using the volatility z-score
- Alternate Expression: The correlation z-score can also be expressed directly in terms of the correlation matrix (Λ) and the individual factor z-scores.
- Scale Independence: The correlation z-score depends on the signs and relative magnitudes of individual factor z-scores, not their absolute values; doubling all shock sizes leaves the correlation z-score unchanged
- Model Adequacy Indicator: A high positive correlation z-score (e.g., above 1.0) signals that the covariance matrix may not adequately capture the true co-movement of policy variable shocks
- Consistency Benchmark: A correlation z-score close to zero suggests the model's covariance structure is consistent with observed shock relationships
Topic 6. Correlation Z-Score
C(r, \Sigma)=\frac{Z(r, \Sigma)}{V(Z)}
C(z, \Lambda)=\sqrt{\frac{z^T}{\sqrt{z^T z}} \Lambda^{-1} \frac{z^T}{\sqrt{z^T z}}}
Practice Questions: Q2
Q2. A risk manager using the MDS approach wants to identify whether a proposed set of policy shocks is an outlier relative to historical data. Which of the following statistical tools should the manager use?
A. Scenario z-score.
B. Volatility z-score.
C. Correlation z-score.
D. Mahalanobis distance.
Practice Questions: Q2 Answer
Explanation: D is correct.
The Mahalanobis distance (MD) is the primary tool for identifying multivariate outliers because it measures how many standard deviations a shock vector lies from the historical center, accounting for correlations. The scenario z-score adjusts the MD for the number of policy variables, the volatility z-score isolates the magnitude of shocks, and
the correlation z-score measures how consistent the shocks are with the covariance structure
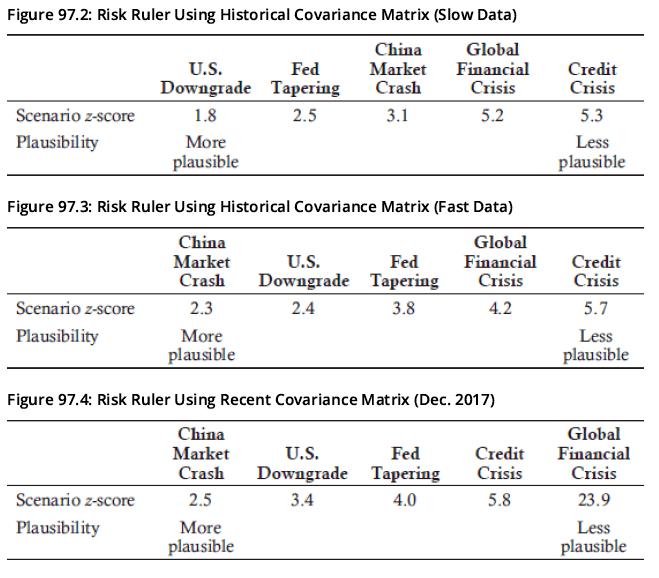
- Impact of Parameter Selection: Choice of date and parameters for constructing the risk factor covariance matrix significantly affects resulting z-scores and stress event comparisons
- Three Common Approaches:
- Slow Data: Historical covariance matrix using long lookback period (e.g., five years of weekly, equally-weighted data before the event)
- Fast Data: Historical covariance matrix using short lookback period (e.g., one year of weekly, equally-weighted data before the event)
- Recent Data: Current covariance matrix reflecting post-event dynamics
- Different Risk Rulers: Each method produces a different risk ruler and changes how surprising a scenario appears, even when evaluating identical events
- Scenario-Appropriate Selection: Covariance matrix choice depends on the scenario being modeled; for market crashes, use data from similar crisis periods since correlations among risky assets typically spike during crises
- Risk of Normal Data: Relying solely on "normal" period data would likely understate the severity of stress events
Topic 7. Covariance Matrix Selection
-
The following figures illustrate risk rulers constructed using the three covariance matrix approaches.
Topic 7. Covariance Matrix Selection
Module 2. Building and Implementing Market-Driven Scenarios
Topic 1. Guidelines for Reducing Subjectivity in MDSs
Topic 2. Steps for Defining and Developing MDSs
Topic 3. MDS Approach: Brexit Example
Topic 4. Implementing MDSs
Topic 1. Guidelines for Reducing Subjectivity in MDSs
-
When constructing scenarios for the MDS approach, the following guidelines and diagnostic tools can help reduce unnecessary subjectivity and improve consistency:
-
Core Guidelines for Scenarios Construction
- Precision in Scenario Definition: Hypothetical scenarios must be defined with sufficient precision to translate clearly into specific shocks on market factors
- Risk Factor Independence: Key risk factors should not be highly correlated with one another to avoid redundancy and multicollinearity issues
- Parsimonious Factor Selection: Selected risk factors should be limited to a small, straightforward set that still effectively captures the key market dynamics
- Balance simplicity with comprehensive risk coverage
- Avoid overcomplicating the model with excessive variables
- Plausibility Assessment: Scenario z-scores can be used as diagnostic tools to evaluate the plausibility, magnitude, and relative sizing of shocks across different risk factors
- Data Consistency: The historical data sample used to generate the covariance matrix should be consistent with the nature and characteristics of the scenario's shocks
Practice Questions: Q1
Q1. Which of the following statements is not recommended when developing a market-driven scenario (MDS) analysis?
A. Specifying hypothetical scenarios precisely so they can be translated into market shocks.
B. Using scenario z-scores to assess the plausibility, magnitude, and relative sizing of shocks.
C. Selecting a covariance matrix sample that reflects market conditions consistent with the scenario.
D. Including a large number of highly correlated key risk factors to maximize coverage of different risks.
Practice Questions: Q1 Answer
Explanation: D is correct.
MDS analysis emphasizes using a small set of policy variables to avoid multicollinearity and instability in the perturbation vector. Scenarios should be defined precisely, scenario z-scores help assess plausibility and severity, and the covariance matrix should be chosen to match the conditions of the scenario being modeled.
Topic 2. Steps for Defining and Developing MDSs
- Step 1 - Define a Market Event: Identify and specify the scenario with precision to reduce uncertainty
- Choose low-probability but plausible scenarios not yet priced into markets
- Define expected market impact (magnitude and direction) clearly and unambiguously
- Ensure scenario affects markets relevant to the portfolio composition
- Identify a specific catalyst that could plausibly trigger the scenario
- Step 2 - Select Policy Variables: Choose key risk factors that anchor the scenario
- Use a small number of simple yet representative variables to minimize multicollinearity
- Avoid adding variables with adjusted R² of 90% or higher relative to existing policy variables
- Consider using "asset blocks" for larger variable sets to reduce correlation overlap
- Step 3 - Calibrate Shock Sizes: Determine appropriate magnitude of shocks to policy variables
- Historical calibration: identify a past period resembling the desired scenario
- Target frequency approach: set likelihood based on subjective probability using scenario z-score
Topic 2. Steps for Defining and Developing MDSs
- Step 4 - Generate Nonpolicy Factor Shocks: Derive implied shocks for remaining risk factors
- Use covariance matrix to translate policy factor shocks into nonpolicy factor shocks
- Select time period for covariance matrix that reflects conditions similar to the modeled scenario
- Step 5 - Estimate Portfolio P&L Impact: Calculate stress test results using factor exposures
- Apply implied nonpolicy factor shocks to portfolio's factor exposures
- Use full revaluation (not linear approximations) for portfolios with embedded optionality
Topic 3. MDS Approach: Brexit Example
- Brexit Context and Market Impact: UK's June 2016 referendum on leaving the EU ("Brexit") was driven by concerns over sovereignty, migration, welfare benefits, regulation, and economic governance; portfolios with exposure to euro, European/British sovereign debt, and European/British equities required Brexit impact assessment
- Three Primary Scenarios Developed:
- Remain: United Kingdom remains an EU member with status quo maintained
- Soft Brexit: UK leaves the EU but preserves largely intact trade relations with Europe
- Adverse Brexit: UK exits the EU with significant deterioration in European trade relations
- Soft Brexit Relationship Models Considered:
- EU single market participation (Norway model)
- Customs union membership (Turkey model)
- "Single-market-lite" agreement (Switzerland model)
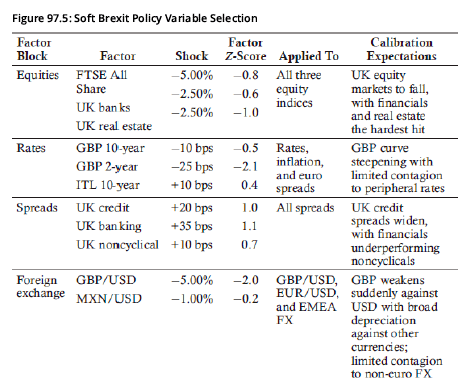
- Expected Soft Brexit Market Consequences: Risk managers and investment teams anticipated risk-off sentiment in financial markets and dovish monetary policy response from the Bank of England
Topic 3. MDS Approach: Brexit Example
- Key Policy Variables for UK Markets: FTSE All Share Index, 10-year gilt yields, and British pound foreign exchange rates; analysis distinguished Soft Brexit-specific impacts (banking sector and housing demand effects) from standard economic downturn effects
Topic 3. MDS Approach: Brexit Example
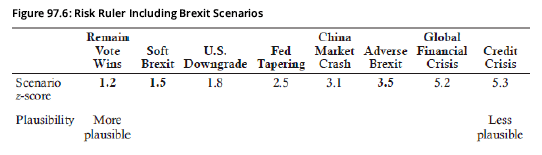
- Risk Probability Hierarchy: On the risk ruler, Remain Vote was positioned as most likely, followed by Soft Brexit as moderately probable, while Adverse Brexit (with severe portfolio impact) was deemed far less likely (Fig. 97.6)
- Limited Historical Comparisons: Direct historical precedents offered minimal guidance for sizing shocks; the 1992 ERM exit was only loosely related as it focused on currency policy without capturing Brexit's broader economic implications
- Gilt Market Uncertainty: The most debated variable was UK government bond (gilts) behavior; Soft Brexit assumed gilts would act as safe haven during volatility, while Adverse Brexit scenario expected yields to rise as investors exit UK fixed-income markets
- Expert Validation: Asset class experts were consulted on policy variables after developing the risk ruler, with no significant changes recommended to the initial framework
Topic 3. MDS Approach: Brexit Example
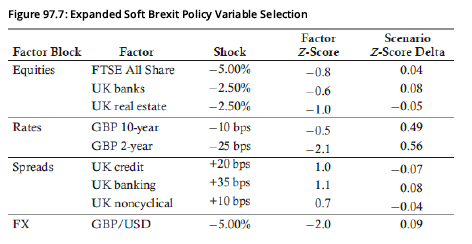
- Z-Score Delta Measurement: The scenario z-score delta quantifies the change in scenario z-score when a policy shock is adjusted from its stressed value to its expected conditional value. This column is added in Fig. 97.7.
- Rates Exception: The delta is approximately zero for all policy shocks except interest rates, indicating rates show inconsistency with other factor shocks in the scenario
- Factor Shock Coherence: Near-zero deltas for non-rate policy shocks show that these factor shocks are largely consistent and aligned with one another within the stress scenario
- Stress-Aligned Historical Data: The time period chosen for the covariance matrix must reflect the specific type of stress being modeled; for example, geopolitical risk scenarios should use data from periods characterized by significant political uncertainty
- Handling Novel Events: When modeling unprecedented events like Brexit with no comparable historical precedent, the covariance matrix should be based on recent data to capture current market relationships and correlations
Topic 3. MDS Approach: Brexit Example
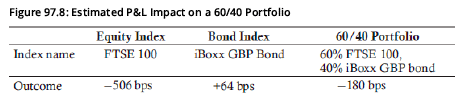
- Example: Portfolio holds 60% in FTSE 100 Index and 40% in iBoxx GBP bond index, with P&L impacts estimated using specified policy shocks through BlackRock's Aladdin platform (Fig. 97.8)
- Offsetting Effects: Significant expected losses in equities were partially offset by gains in bonds, demonstrating diversification benefits across asset classes during stress scenarios
- MDS Framework Objective: The Macroeconomic Scenario (MDS) approach is not designed to quantify tail losses or mandate specific risk targets, but rather to integrate insights from different perspectives in a structured framework
- Strategic Value: By quantifying returns across scenarios with varying plausibility levels, MDS encourages risk managers to reassess strategic convictions and increases awareness of potential impacts from alternative market outcomes
Topic 4. Implementing MDSs
- Subjectivity in Scenario Design: MDS relies on expert judgment to define hypothetical yet plausible market shocks rather than purely historical data
- No universally accepted methodology for constructing scenarios, leading to potential inconsistencies
- Limited research on best practices requires organizations to develop internal frameworks
- Increases risk of bias and groupthink during scenario development
- Translating Economic Events into Quantitative Shocks: Converting macroeconomic developments into specific policy variable shocks is inherently subjective
- Varies significantly based on expertise and perspectives of individuals involved
- May rely too heavily on educated guesses rather than robust structural models
- Risk of failing to capture out-of-sample dynamics or unexpected interactions
- Balancing Simplicity and Accuracy: Tension between comprehensive coverage and model parsimony
- Need sufficient variables to capture scenario essence while maintaining effectiveness
- Too many policy variables introduce multicollinearity and model instability
- Redundant or highly correlated factors reduce reliability, especially as market conditions change
Topic 4. Implementing MDSs
- Covariance Matrix Calibration and Selection: Choice of shock magnitudes and estimation period substantially affects results
- "Normal" versus "stressed" market data produce very different outcomes for identical shocks
- No universally accepted rule for selecting historical window or estimation method
- Risk of misspecification if covariance matrix doesn't reflect intended scenario
- Shock Design and Plausibility Evaluation: Implied shocks to non-policy factors driven by covariance structure may not reflect current conditions
- Statistical measures (Mahalanobis distance, scenario z-scores) still require judgment about reasonableness
- Quality depends on appropriateness of historical covariance matrix selection
- Organizational and Process Considerations: Effective implementation requires cross-functional collaboration
- Integration of diverse views from risk managers, economists, and investors essential
- Must avoid groupthink while maintaining transparency and constructive challenge
- Final output quality depends on underlying assumptions and disciplined scenario construction
Practice Questions: Q2
Q2. Which of the following statements best describes a key challenge in implementing an MDS approach?
A. Scenario development often depends on expert judgment.
B. Using only historical data is recommended when constructing scenarios.
C. Using a large number of policy variables guarantees more accurate and reliable scenario outputs.
D. Translating economic events into quantitative policy shocks relies solely on objective statistical models.
Practice Questions: Q2 Answer
Explanation: A is correct.
A major challenge in implementing the MDS approach is the reliance on expert judgment, which introduces subjectivity into scenario design. MDSs require a small, carefully selected set of policy variables to avoid multicollinearity, and the choice of data period for the covariance matrix is critical because it must align with the type of stress being modeled.
IM 15. Market-Driven Scenarios- An Approach for Plausible Scenario Construction
By Prateek Yadav


