Social and Political Data Science: Introduction

Information Management

Karl Ho

School of Economic, Political and Policy Sciences

University of Texas at Dallas

Introduction to Shiny

Overview

  • What is Shiny?

  • Components of Shiny

  • Structure of Shiny app

  • Publicizing Shiny app on GitHub

What is Shiny?

A Shiny app is a web page  with user interface (UI) connected to a computer running a live R session (Server).

Users can design the UI, which provide interactive interface to visualize data (by running R code).

Shiny app = R + Interactivity + Web hosting

Presenting interactive data and charts

Shiny deployment

  • RStudio Shiny server (http://www.shinyapps.io )

    • Needs Shiny account (connect via GitHub/Google)

  • Pro Shiny account (commercial)

  • Install own Shiny server (https://github.com/rstudio/shiny-server)

    • ​Linux server
    • Free and open source

Shiny reference and resources

Components of Shiny

  1. User Interface (ui.R) — The UI is the frontend that accepts user input values.

  2. Server function (server.R) — The Server is the backend that processes these input values to produce the output results that are finally displayed on the website.

  3. shinyApp function — The app itself that bundles the UI and server components together.

Layout and interface

  • Design & explore UI framework
    • Inputs within the UI framework
    • Outputs within the UI framework
  • Assemble UI with HTML/CSS/... widgets
  • Adjustment of the layout scheme

Structure of Shiny program

# install.packages("shiny")
# install.packages("shinythemes")

library(shiny)
library(shinythemes)
# Create User Interface
ui <− fluidPage ()

# Build R objects displayed in UI
server <− function(input , output){}  

# Create Shiny app
shinyApp(ui = ui, server = server)
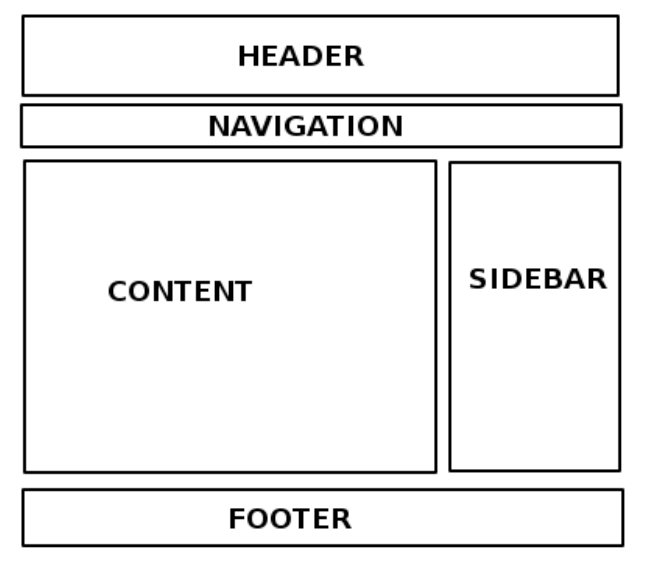
  • ui: Nested R functions that assemble an HTML user interface for the app (some HTML knowledge needed)

  • server: A function with instructions on how to build and rebuild the R objects displayed in the UI

  • shinyApp: Combines ui and server into a functioning app

ui.R

  • Nested R functions that assemble an HTML user interface for the app

  • Example:


    • ui = creates the user interface object
      • fluidPage() function create the layout page that includes:
        • input 
        • output
library(shiny)
ui = fluidPage(
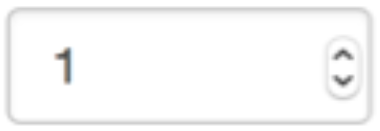
  numericInput(inputId = "n", "Sample size", value = 50),
  plotOutput(outputId = "hist")) 

server.R

  • Composed of R codes to process input and generate output:

    • Example:


      • Read in the data from input (from ui.R)
      • Create the chart (i.e. histogram)
server = function(input , output){ output$hist = renderPlot ({
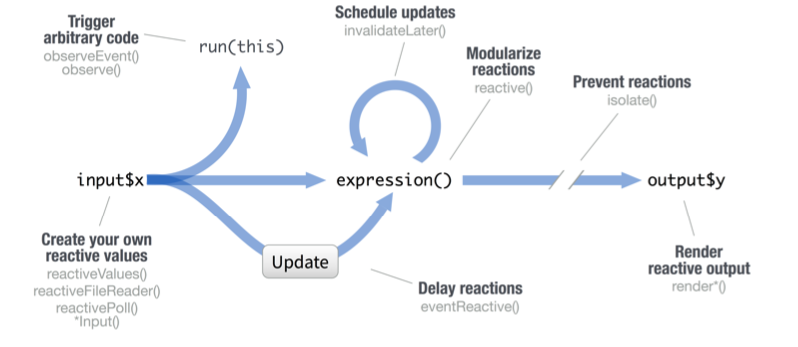
    hist(rnorm(input$n)) })}

shinyApp()

  • Combine ur.R and server.R and execute

    • Example:

       
      • Output in plot window ready for publishing
shinyApp(ui = ui , server = server)

Reactivity

  • Reactive values work together with reactive functions. Call a reactive value from within the arguments of one of these functions to avoid the error

  • Operation not allowed without an active reactive context.

fileInput(inputId, label, multiple, accept)
numericInput(inputId, label, value, min, max, step)
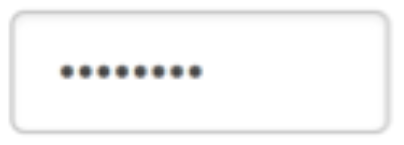
passwordInput(inputId, label, value)
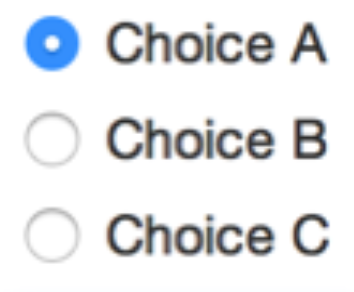
radioButtons(inputId, label, choices, selected, inline)
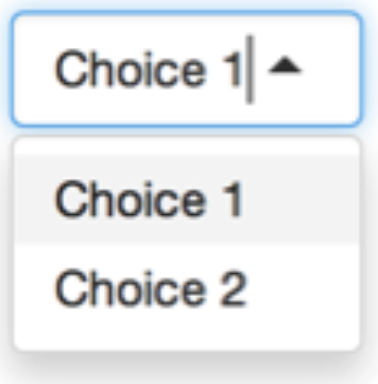
selectInput(inputId, label, choices,
selected, multiple, selectize, width, size) (also selectizeInput())
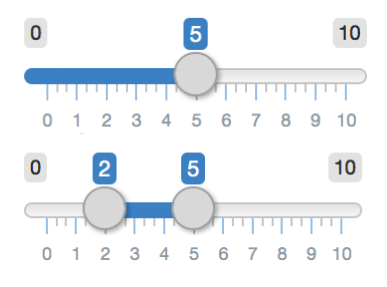
sliderInput(inputId, label, min, max, value, step, round, format, locale, ticks, animate, width, sep, pre, post)

Inputs

Information Management: Introduction to Shiny

By Karl Ho

Information Management: Introduction to Shiny

  • 229