Stock Market
Trading Simulation
Stock Market
Trading Simulation
股票模擬交易-均值回歸策略
均值回歸策略
均值回歸策略
Mean Reversion Startegy
均值回歸策略
Mean Reversion Startegy
EBBS AND FLOWS
均值回歸策略
Mean Reversion Startegy
均值回歸策略
Mean Reversion Startegy
對於長遠股市我們用 0.15% 來交易
對於上漲波動股市我們用 1.5% 來交易
均值回歸策略
Mean Reversion Startegy
1.在波動市場中保持穩定
均值回歸策略
Mean Reversion Startegy
1.在波動市場中保持穩定
2.實際運用
import matplotlib.pyplot as pltfor _ in range(1, days):
change = random.uniform(-2, 2)
new_price = prices[-1] * (1 + change / 100)
prices.append(new_price)for i in range(1, days):
today = prices[i]
yesterday = prices[i-1]
change_pct = (today - yesterday) / yesterday * 100
#if ahhhhhhhhh find reset point
if change_pct < -1.5 and cash >= today:
shares += 1
cash -= today
history.append(f"Day {i}: Bought at {today:.2f}")
elif change_pct > 1.5 and shares > 0:
shares -= 1
cash += today
history.append(f"Day {i}: Sold at {today:.2f}")portfolio_value = cash + shares * prices[-1]
#剩餘的本金加股票的價值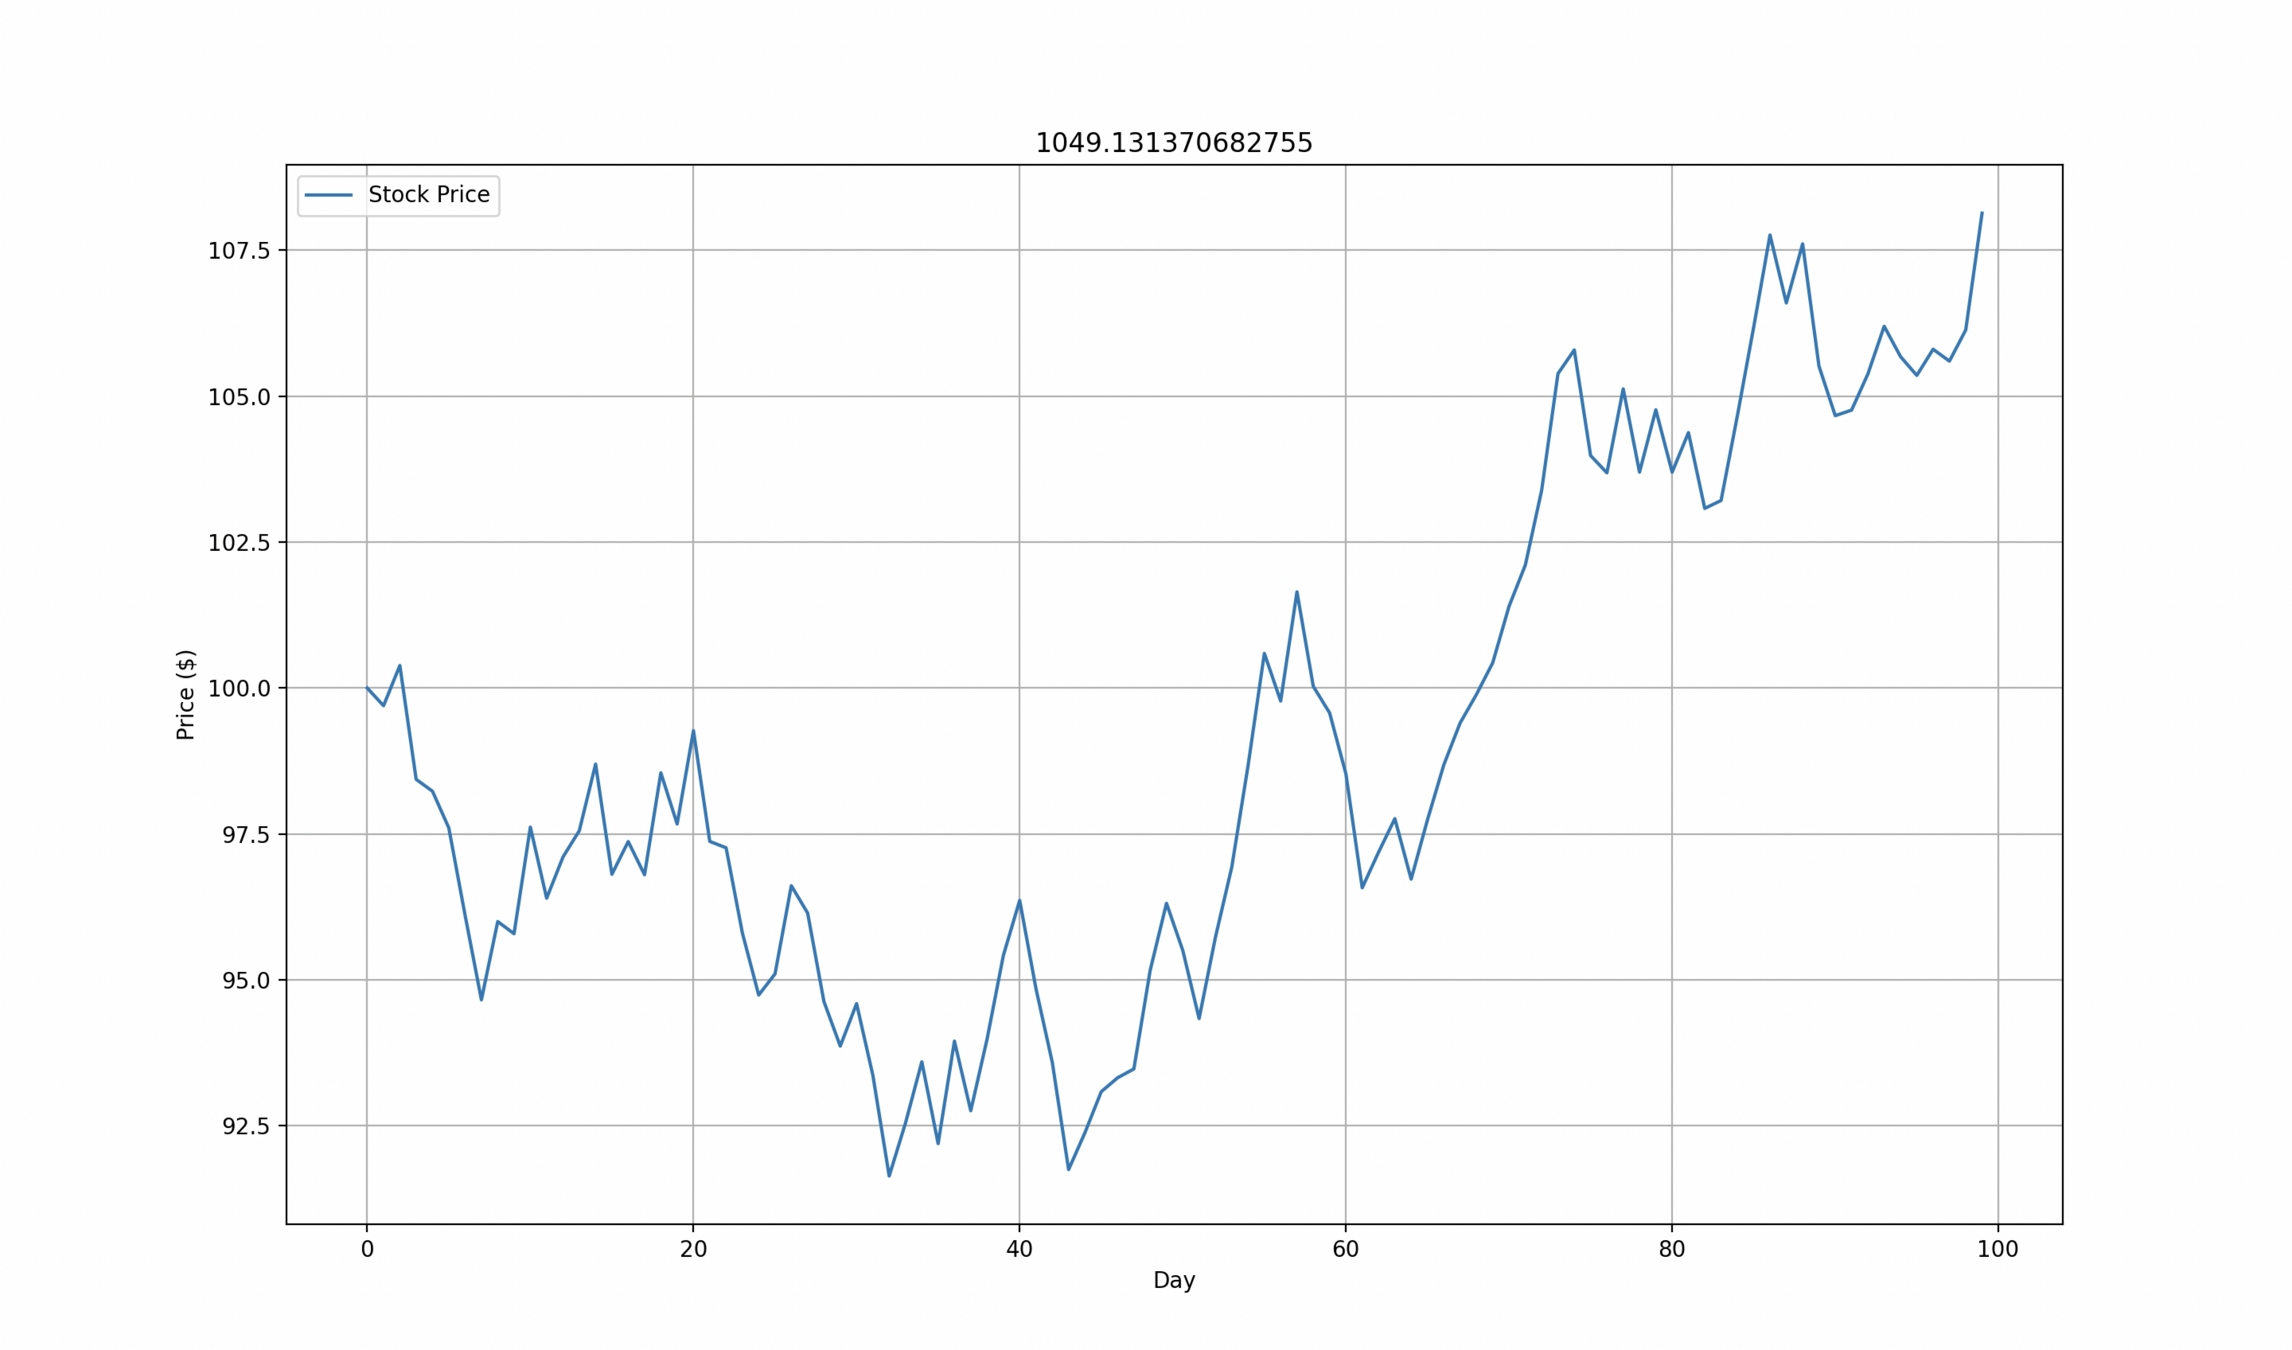
import matplotlib.pyplot as plt問題
import yfinance as yf
import matplotlib.pyplot as plt
TICKER = 'AAPL'
PERIOD = '1mo'
INTERVAL = '30m'
THRESHOLD = 0.0015 # 0.15%
INITIAL_CAPITAL = 10000.0
data = yf.download(TICKER, period=PERIOD, interval=INTERVAL)
prices = data['Close'].values
dates = data.index
position = True
buy_price = float(prices[0])
sell_price = None
capital = 0.0
quantity = INITIAL_CAPITAL / buy_price
buy_signals = [dates[0]]
sell_signals = []
for i in range(1, len(prices)):
p = float(prices[i])
current_date = dates[i]
#check the reset point if avilable ahhhh no
if position:
if p >= buy_price * (1 + THRESHOLD):
sell_price = p
capital = quantity * sell_price
quantity = 0.0
position = False
sell_signals.append(current_date)
print(f"SELL at ${p:.2f} on {current_date}")
else:
if p <= sell_price * (1 - THRESHOLD):
buy_price = p
quantity = capital / buy_price
capital = 0.0
position = True
buy_signals.append(current_date)
print(f"BUY at ${p:.2f} on {current_date}")
final_value = capital + quantity * float(prices[-1])
plt.figure(figsize=(14,6))
plt.plot(dates, prices, label=f'{TICKER} Close', color='blue')
plt.plot(buy_signals, data['Close'].loc[buy_signals], '^', markersize=10, color='green', label='Buy')
plt.plot(sell_signals, data['Close'].loc[sell_signals], 'v', markersize=10, color='red', label='Sell')
plt.title(f'{TICKER} Price with 0.15% Reversion Strategy (1m)\nFinal Portfolio Value: ${final_value:,.2f}')
plt.xlabel('Date')
plt.ylabel('Price (USD)')
plt.legend()
plt.grid(True)
plt.tight_layout()
plt.show()
print(f"\nFinal Portfolio Value: ${final_value:,.2f}")
print("class dismissed!!!")import yfinance as yf
import matplotlib.pyplot as plt
TICKER = 'AAPL'
PERIOD = '1mo'
INTERVAL = '30m'
THRESHOLD = 0.0015 # 0.15%
INITIAL_CAPITAL = 10000.0
data = yf.download(TICKER, period=PERIOD, interval=INTERVAL)
prices = data['Close'].values
dates = data.index
position = True
buy_price = float(prices[0])
sell_price = None
capital = 0.0
quantity = INITIAL_CAPITAL / buy_price
buy_signals = [dates[0]]
sell_signals = []
for i in range(1, len(prices)):
p = float(prices[i])
current_date = dates[i]
#check the reset point if avilable ahhhh no
if position:
if p >= buy_price * (1 + THRESHOLD):
sell_price = p
capital = quantity * sell_price
quantity = 0.0
position = False
sell_signals.append(current_date)
print(f"SELL at ${p:.2f} on {current_date}")
else:
if p <= sell_price * (1 - THRESHOLD):
buy_price = p
quantity = capital / buy_price
capital = 0.0
position = True
buy_signals.append(current_date)
print(f"BUY at ${p:.2f} on {current_date}")
final_value = capital + quantity * float(prices[-1])
plt.figure(figsize=(14,6))
plt.plot(dates, prices, label=f'{TICKER} Close', color='blue')
plt.plot(buy_signals, data['Close'].loc[buy_signals], '^', markersize=10, color='green', label='Buy')
plt.plot(sell_signals, data['Close'].loc[sell_signals], 'v', markersize=10, color='red', label='Sell')
plt.title(f'{TICKER} Price with 0.15% Reversion Strategy (1m)\nFinal Portfolio Value: ${final_value:,.2f}')
plt.xlabel('Date')
plt.ylabel('Price (USD)')
plt.legend()
plt.grid(True)
plt.tight_layout()
plt.show()
print(f"\nFinal Portfolio Value: ${final_value:,.2f}")
print("class dismissed!!!")pip install yfinanceplt.plot
(buy_signals, data['Close'].loc[buy_signals], '^',
markersize=10, color='green', label='Buy')
plt.plot
(sell_signals, data['Close'].loc[sell_signals], 'v',
markersize=10, color='red', label='Sell')plt.plot
(buy_signals, data['Close'].loc[buy_signals], '^',
markersize=10, color='green', label='Buy')
plt.plot
(sell_signals, data['Close'].loc[sell_signals], 'v',
markersize=10, color='red', label='Sell')plt.plot
(buy_signals, data['Close'].loc[buy_signals], '^',
markersize=10, color='green', label='Buy')
plt.plot
(sell_signals, data['Close'].loc[sell_signals], 'v',
markersize=10, color='red', label='Sell')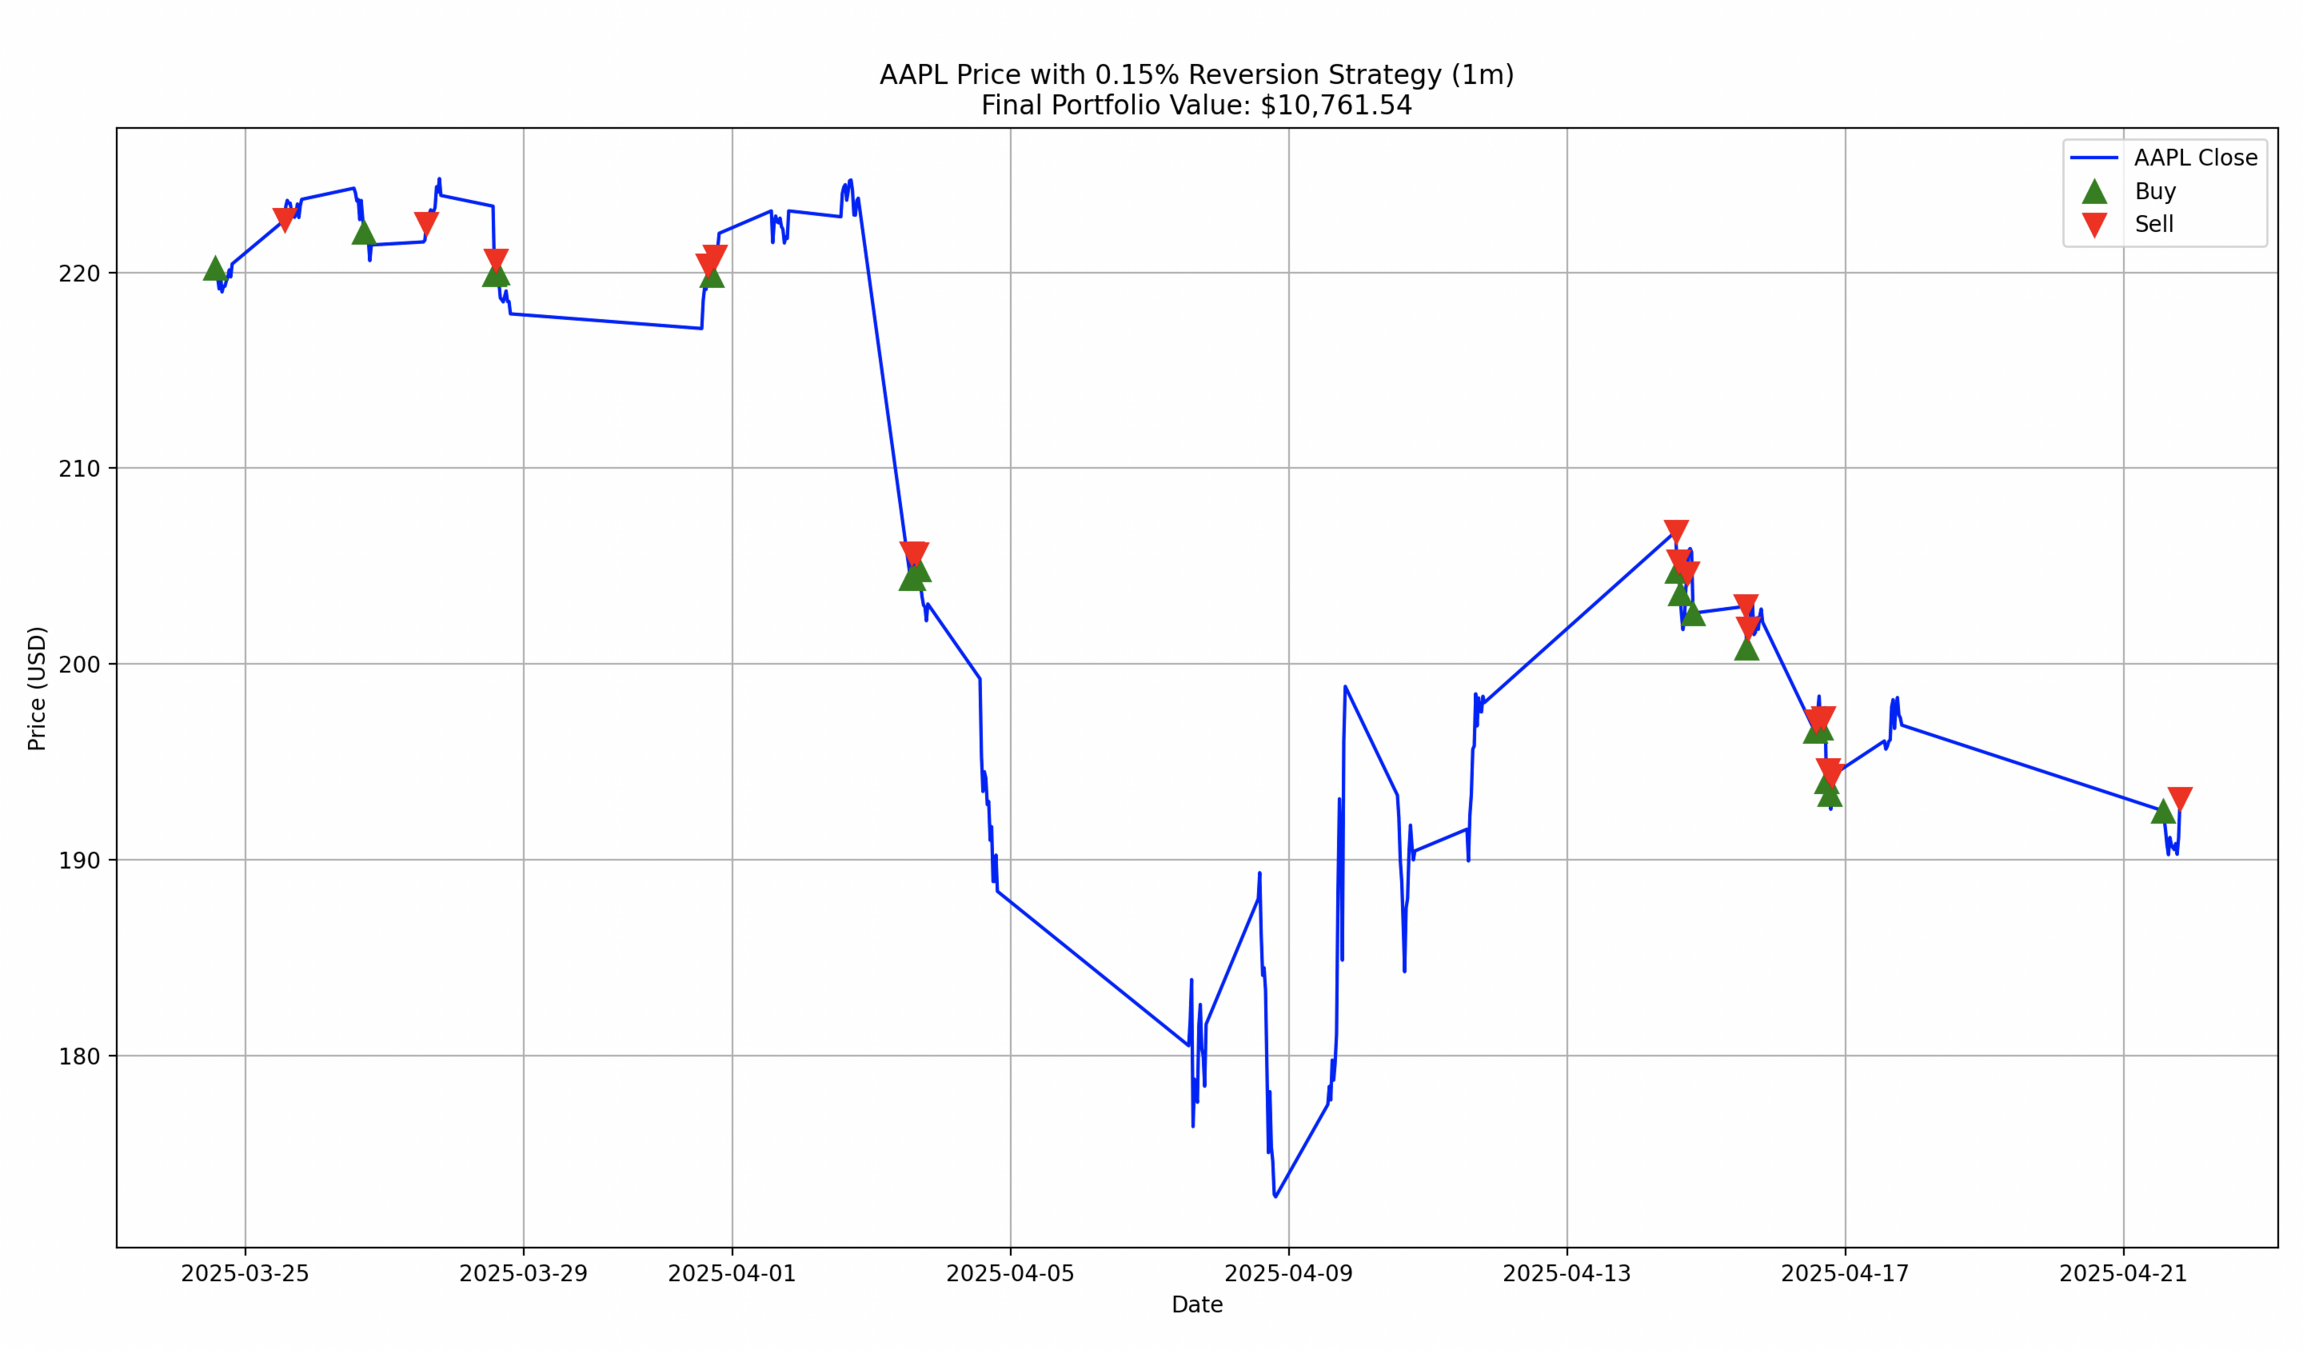
RESET POINT
RESET POINT
本金分配
RESET POINT
本金分配 -> random 每筆投資
RAND_T
import random
import matplotlib.pyplot as plt
days = 100
initial_price = 100
prices = [initial_price]
for _ in range(1, days):
    change = random.uniform(-2, 2)
    new_price = prices[-1] * (1 + change / 100)
    prices.append(new_price)
cash = 1000
shares = 0
history = []
for i in range(1, days):
    today = prices[i]
    yesterday = prices[i-1]
    change_pct = (today - yesterday) / yesterday * 100
    #if ahhhhhhhhh find reset point
    if change_pct < -1.5 and cash >= today:
        shares += 1
        cash -= today
        history.append(f"Day {i}: Bought at {today:.2f}")

    elif change_pct > 1.5 and shares > 0:
        shares -= 1
        cash += today
        history.append(f"Day {i}: Sold at {today:.2f}")
portfolio_value = cash + shares * prices[-1]
print("\n".join(history))
print(f"\nFinal Portfolio Value: ${portfolio_value:.2f}")
plt.plot(prices, label="Stock Price")
plt.title(portfolio_value)# i need title
plt.xlabel("Day")
plt.ylabel("Price ($)")
plt.grid(True)
plt.legend()
plt.show()APPL_1mo (0.15%)
import yfinance as yf
import matplotlib.pyplot as plt

TICKER     = 'AAPL'
PERIOD     = '1mo'
INTERVAL   = '30m'
THRESHOLD  = 0.0015 # 0.15%
INITIAL_CAPITAL = 10000.0

data = yf.download(TICKER, period=PERIOD, interval=INTERVAL)
prices = data['Close'].values
dates  = data.index

position = True
buy_price = float(prices[0])
sell_price = None
capital = 0.0
quantity = INITIAL_CAPITAL / buy_price
buy_signals = [dates[0]]
sell_signals = []

for i in range(1, len(prices)):
    p = float(prices[i])
    current_date = dates[i]
    #check the reset point if avilable ahhhh no
    if position:
        if p >= buy_price * (1 + THRESHOLD):
            sell_price = p
            capital = quantity * sell_price
            quantity = 0.0
            position = False
            sell_signals.append(current_date)
            print(f"SELL at ${p:.2f} on {current_date}")
    else:
        if p <= sell_price * (1 - THRESHOLD):
            buy_price = p
            quantity = capital / buy_price
            capital = 0.0
            position = True
            buy_signals.append(current_date)
            print(f"BUY  at ${p:.2f} on {current_date}")

final_value = capital + quantity * float(prices[-1])

plt.figure(figsize=(14,6))
plt.plot(dates, prices, label=f'{TICKER} Close', color='blue')
plt.plot(buy_signals,  data['Close'].loc[buy_signals],  '^', markersize=10, color='green', label='Buy')
plt.plot(sell_signals, data['Close'].loc[sell_signals], 'v', markersize=10, color='red',   label='Sell')
plt.title(f'{TICKER} Price with 0.15% Reversion Strategy (1m)\nFinal Portfolio Value: ${final_value:,.2f}')
plt.xlabel('Date')
plt.ylabel('Price (USD)')
plt.legend()
plt.grid(True)
plt.tight_layout()
plt.show()

print(f"\nFinal Portfolio Value: ${final_value:,.2f}")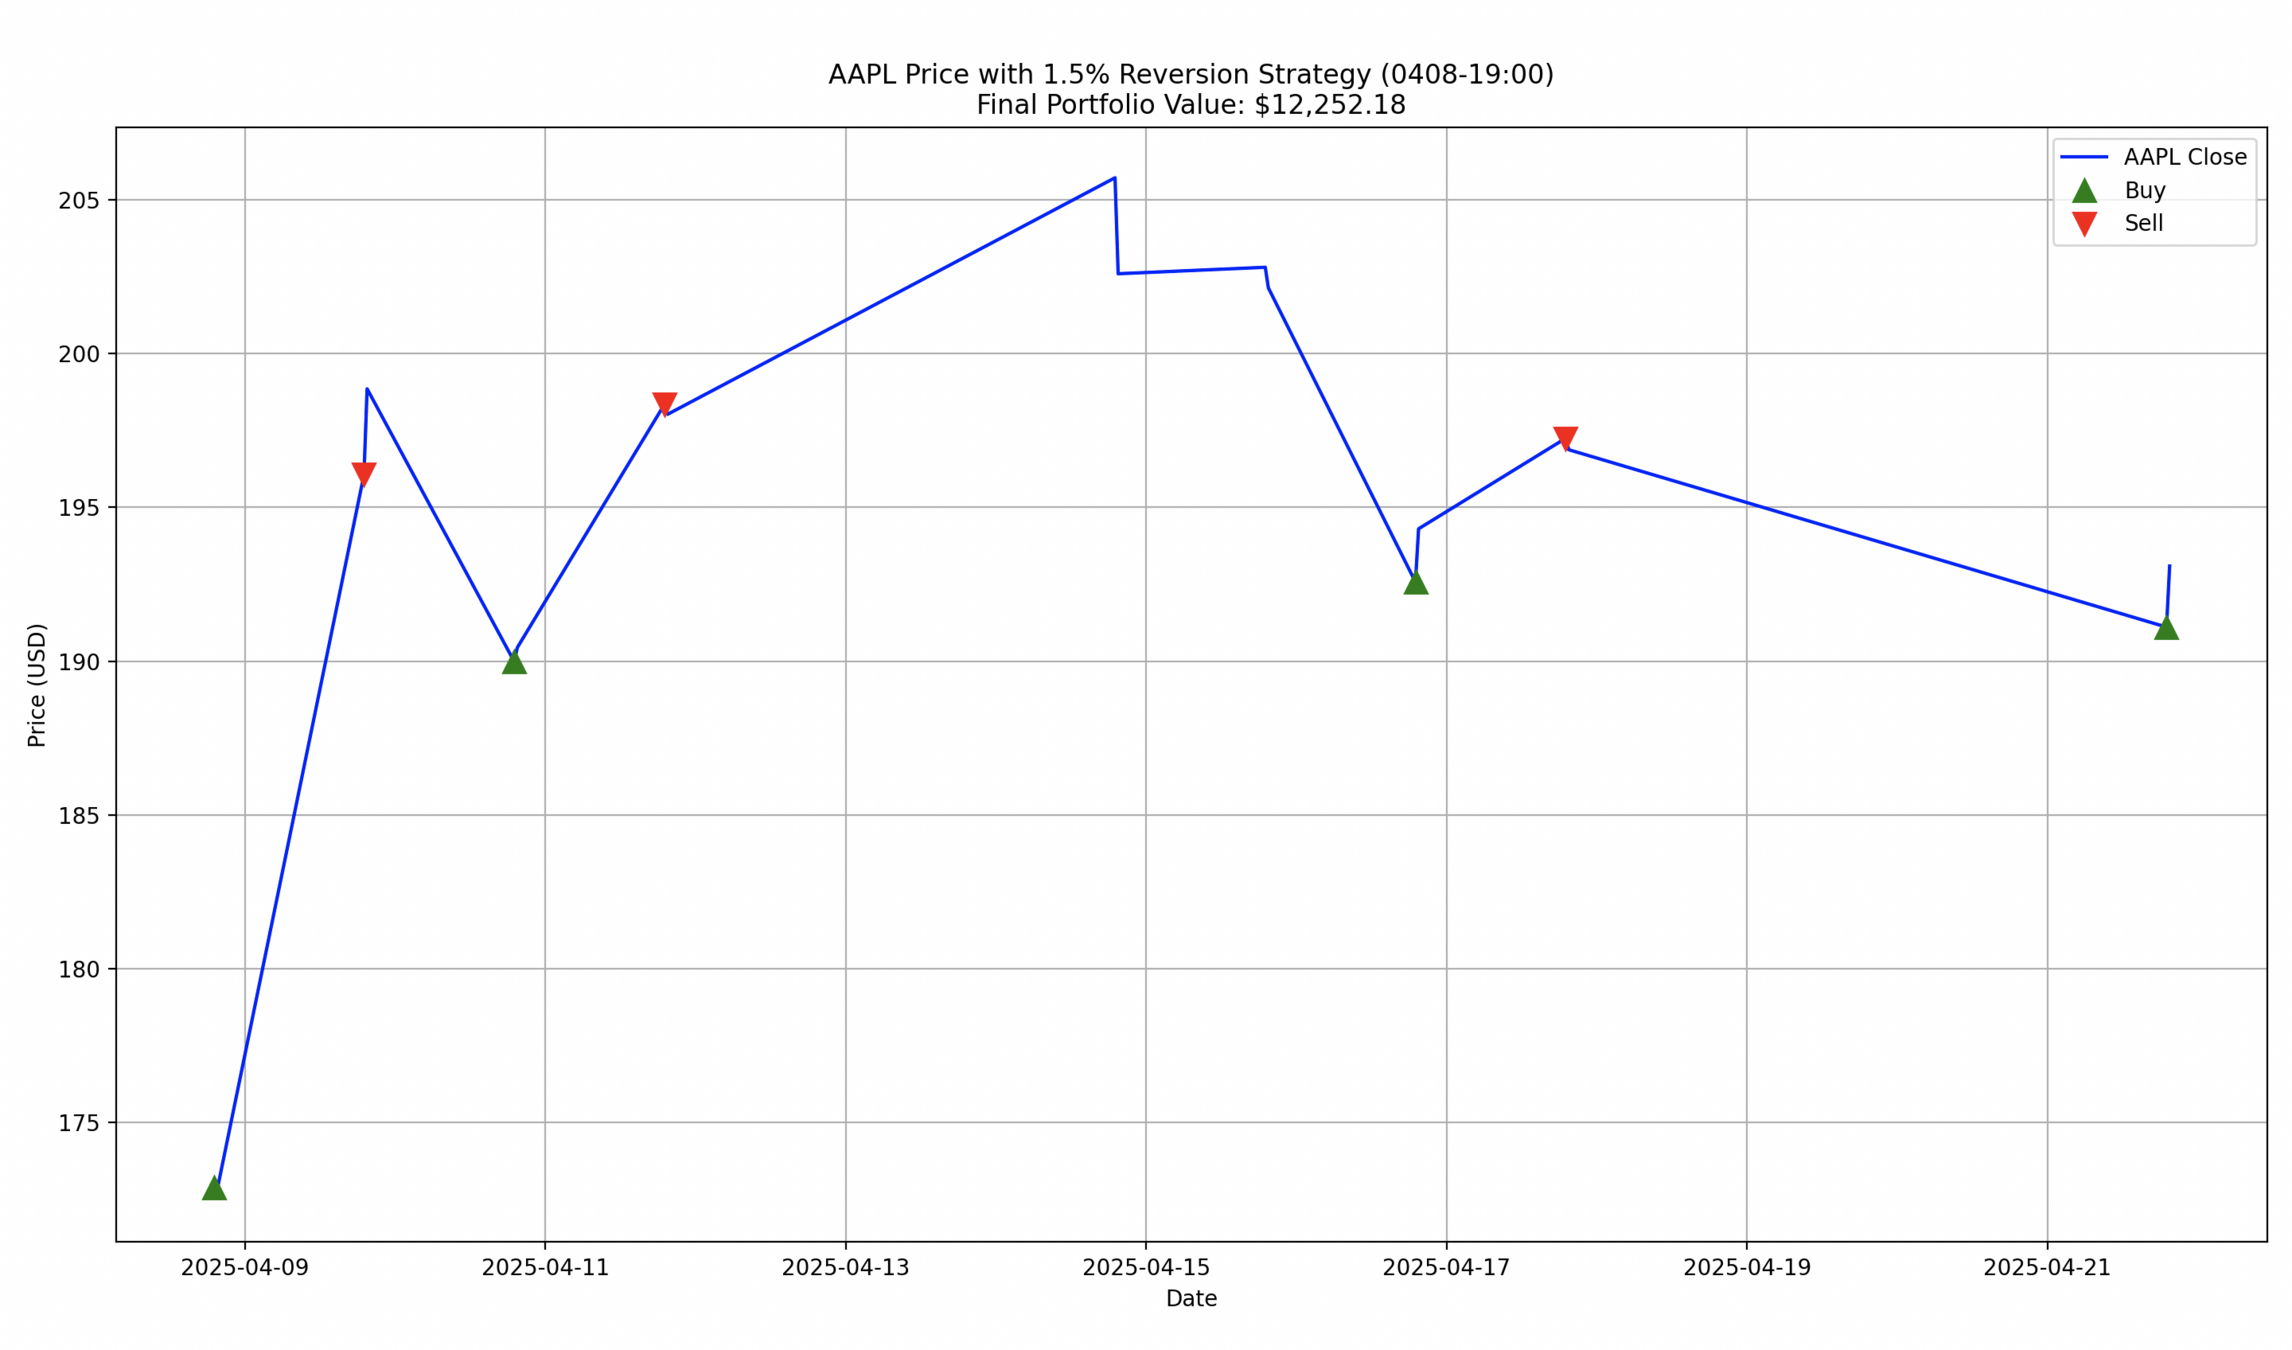
print("class dismissed!!!")APPL_4/8 (1.5%)
import yfinance as yf
import matplotlib.pyplot as plt

TICKER     = 'AAPL'
PERIOD     = '1mo'
INTERVAL   = '30m'
THRESHOLD  = 0.015 # 1.5% (adjustable)
INITIAL_CAPITAL = 10000.0
START_DATE = '2025-04-08'

data = yf.download(TICKER, start=START_DATE, period=PERIOD, interval=INTERVAL)

data = data[data.index.hour >= 19]

prices = data['Close'].values
dates  = data.index

position = True
buy_price = float(prices[0])
sell_price = None
capital = 0.0
quantity = INITIAL_CAPITAL / buy_price
buy_signals = [dates[0]]
sell_signals = []

for i in range(1, len(prices)):
    p = float(prices[i])
    current_date = dates[i]
    # Check the reset point if available(no
    if position:
        if p >= buy_price * (1 + THRESHOLD):
            sell_price = p
            capital = quantity * sell_price
            quantity = 0.0
            position = False
            sell_signals.append(current_date)
            print(f"SELL at ${p:.2f} on {current_date}")
    else:
        if p <= sell_price * (1 - THRESHOLD):
            buy_price = p
            quantity = capital / buy_price
            capital = 0.0
            position = True
            buy_signals.append(current_date)
            print(f"BUY  at ${p:.2f} on {current_date}")

final_value = capital + quantity * float(prices[-1])

plt.figure(figsize=(14, 6))
plt.plot(dates, prices, label=f'{TICKER} Close', color='blue')
plt.plot(buy_signals, data['Close'].loc[buy_signals], '^', markersize=10, color='green', label='Buy')
plt.plot(sell_signals, data['Close'].loc[sell_signals], 'v', markersize=10, color='red', label='Sell')
plt.title(f'{TICKER} Price with 1.5% Reversion Strategy (0408-19:00)\nFinal Portfolio Value: ${final_value:,.2f}')
plt.xlabel('Date')
plt.ylabel('Price (USD)')
plt.legend()
plt.grid(True)
plt.tight_layout()
plt.show()

print(f"\nFinal Portfolio Value: ${final_value:,.2f}")
print("class dismissed!!!")
deck
By chen0121


