Large Science Models:
Metabolomics for ASD
Ishanu Chattopadhyay, PhD
Assistant Professor of Biomedical Informatics & Computer Science
University of Kentucky

LSM Inference
| Number of metabolites | 5,280 | 85% untargeted metabolites |
|---|---|---|
| Number of parameters | 4,002,306 | |
| Average Tree Depth | 38.62 | |
| Number of constraints inferred | 108,884 | ~83% involve untargeted metabolites |
| Number of samples used | 180 | (no clinical phenotype information used) |
-
Using all samples of metabolite profiles
-
Not using clinical phenotypes and replicates
LSM Inference

LSM Inference

LSM Inference

R_{\mathcal A}(y)
:=
\|L(y)\|_2
=
\left(
\sum_{k=1}^K
\bigl[-\log \Pr(a_k\to y)\bigr]^2
\right)^{1/2}
LSM Risk of ASD
ASD sample profile
ASD samples from same patient
sample profile of new patient \(y\)
Pr(a \rightarrow y)
Need one patient!
Predictive Performance
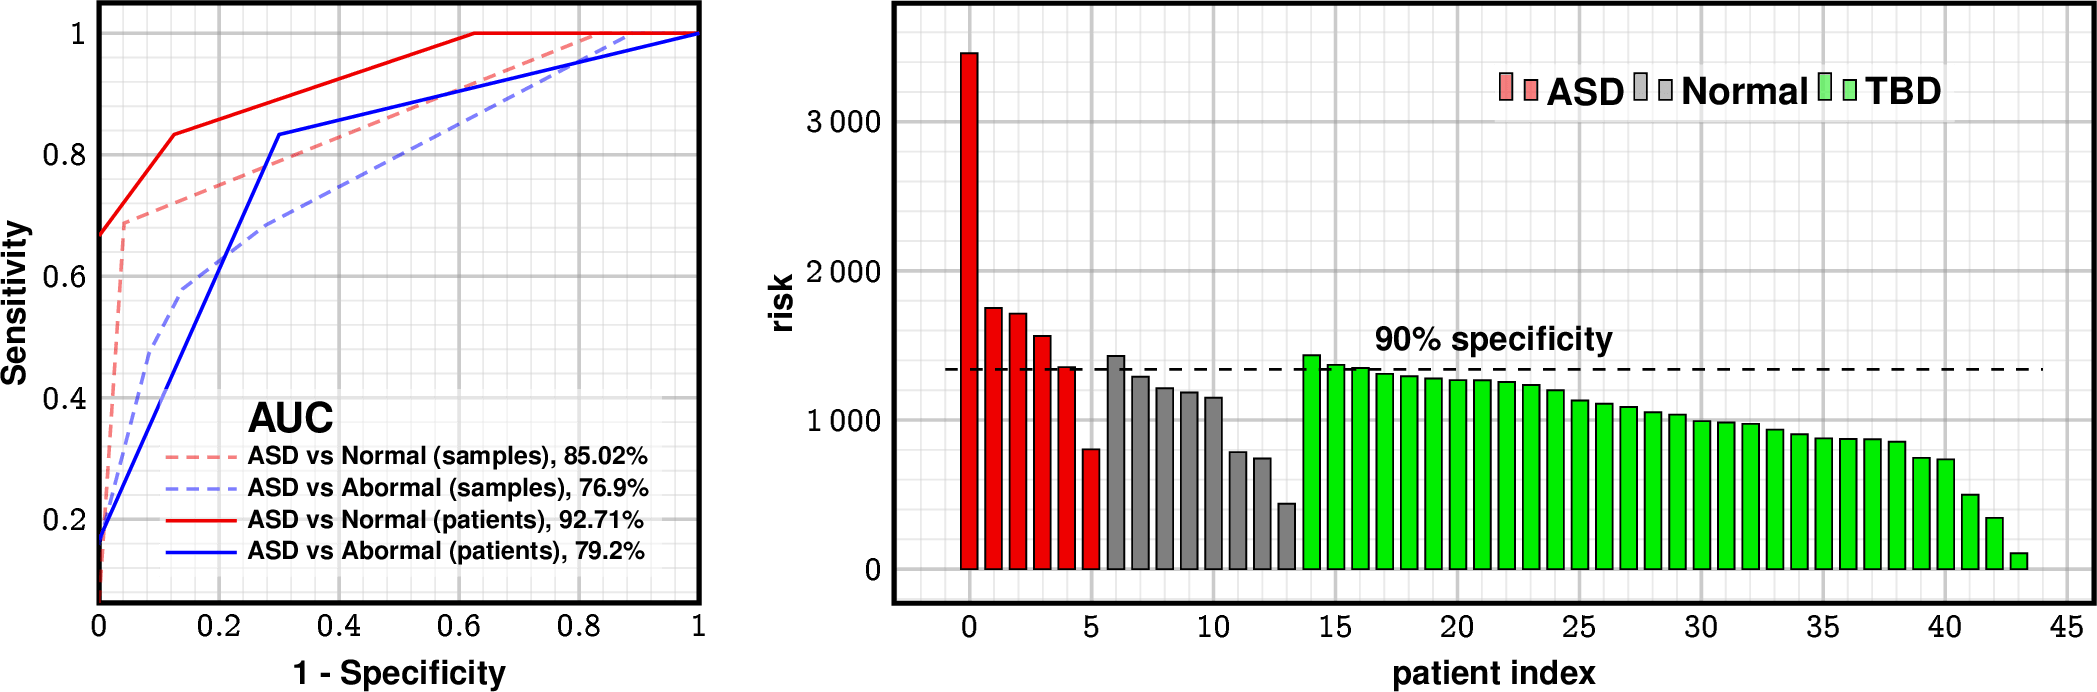
| AUC | Sensitivity at 95% spec | |
|---|---|---|
| LSM | 92.7% | 74% |
| MCHAT/F | 67% | 39% |
| ADOS-2 | 90-97% | 85% |
getting close to the gold standard
1 false positive
1 false negative
10% flag in TBD (expected 8.3% positives)
Predictive Performance
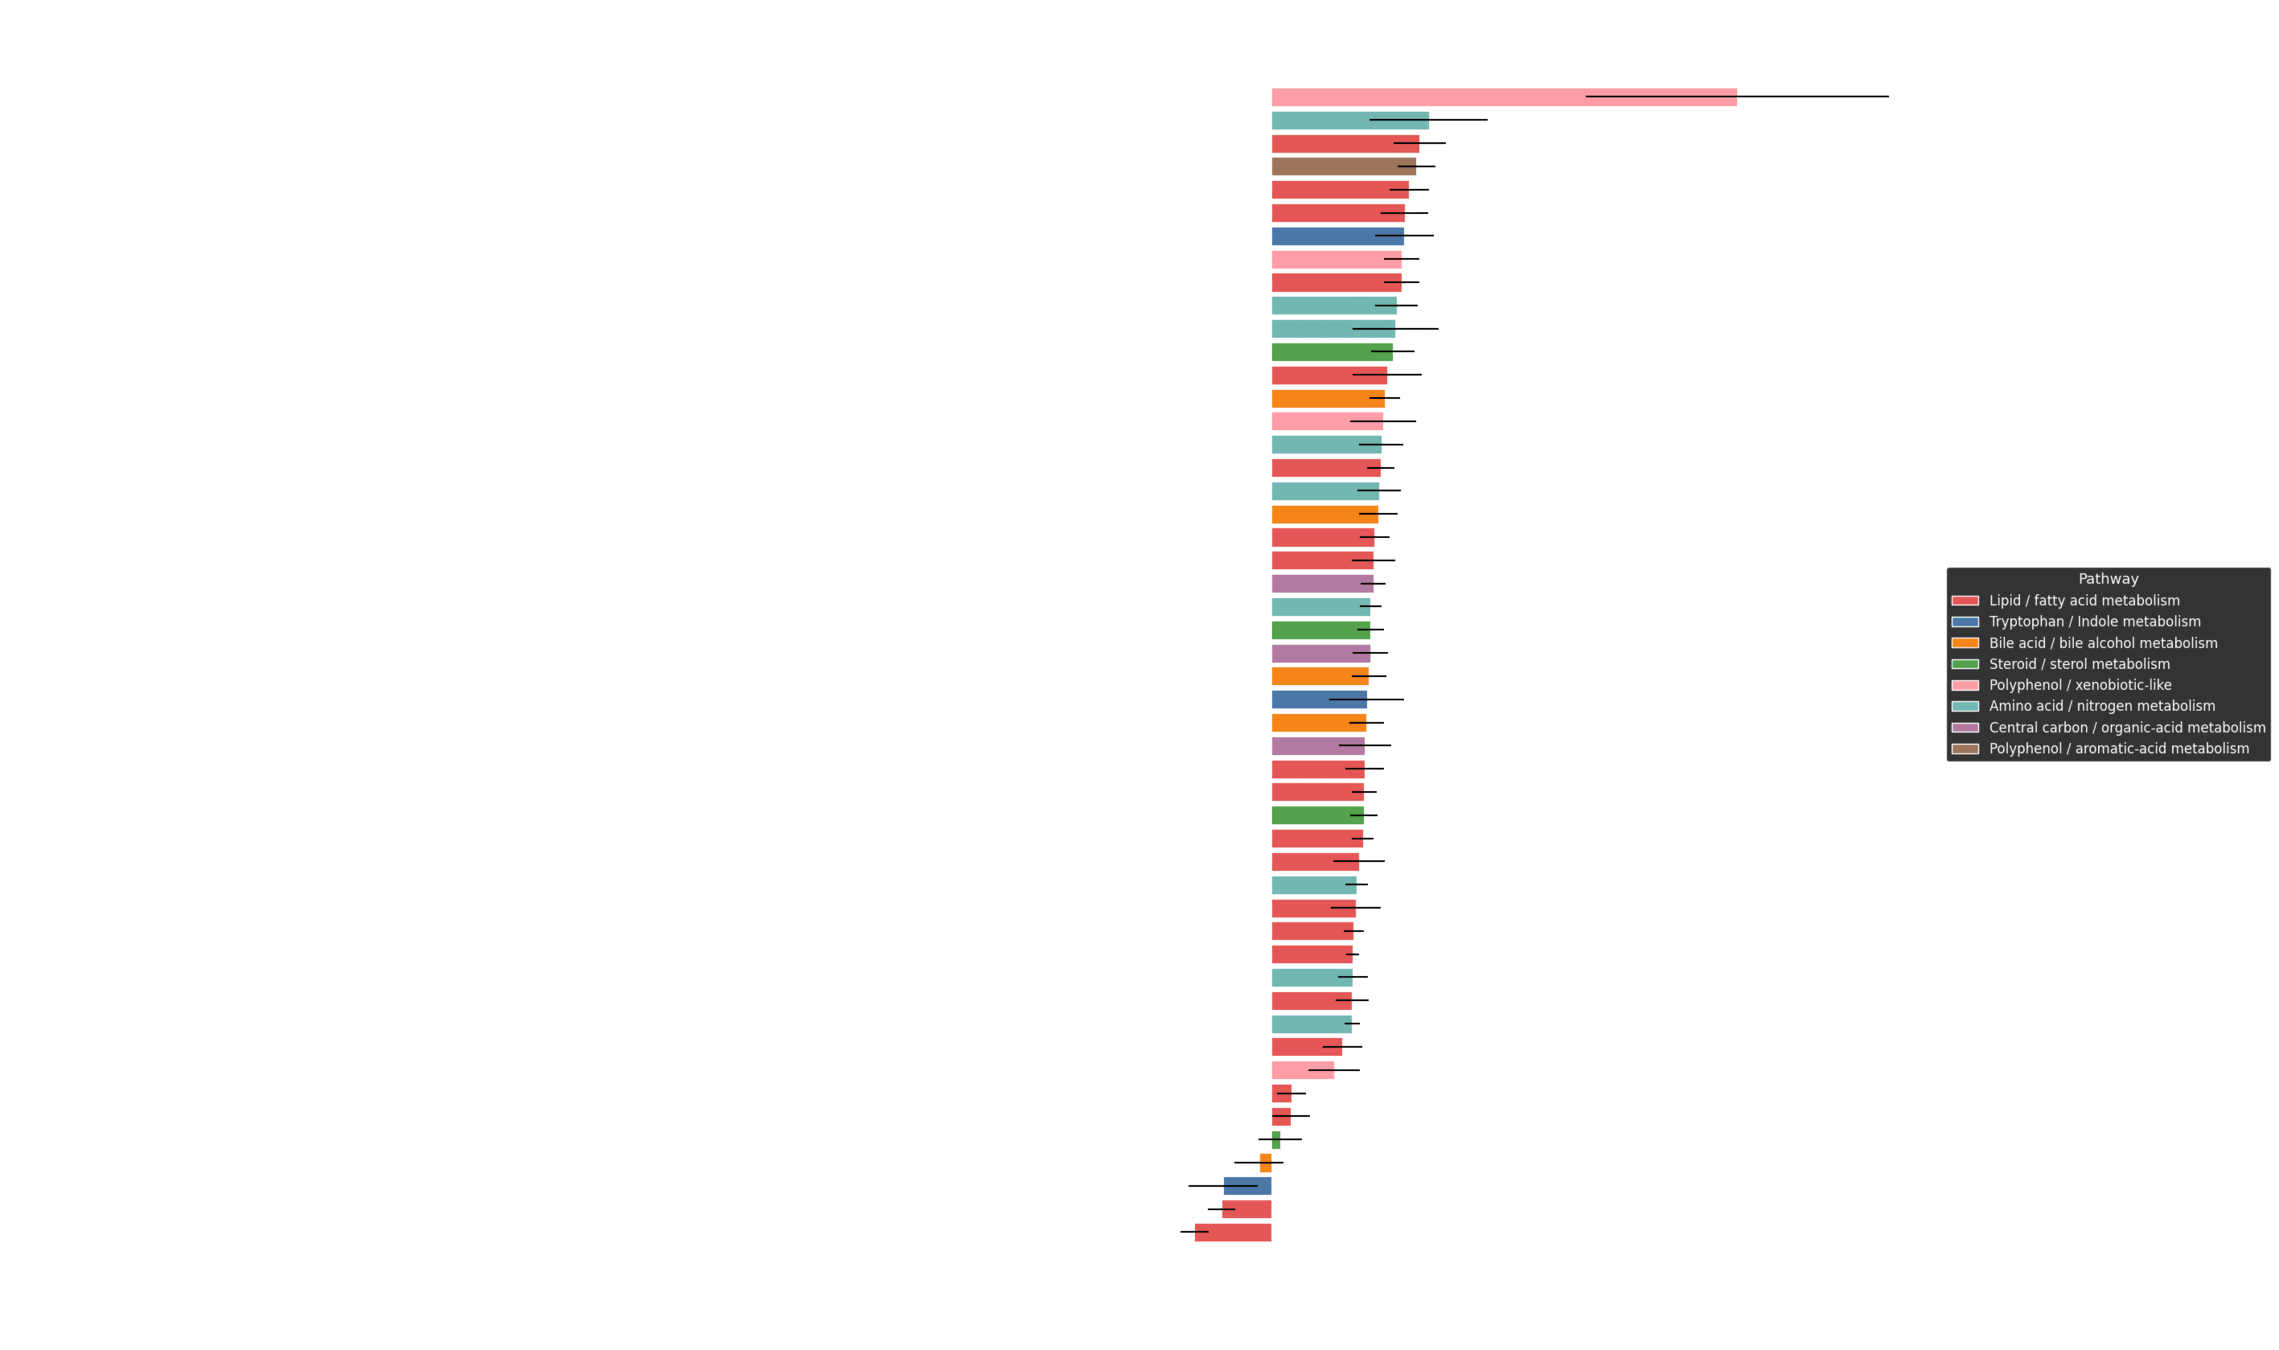
Perturbation Dynamics: Estimating the Top Drivers of Risk
P_x(m_j) = \frac{\partial R(x)}{\partial m_j}
\displaystyle P(m_j) = \frac{1}{N} \sum_x P_x(m_j)
Patient specific driver profile
Average driver profile
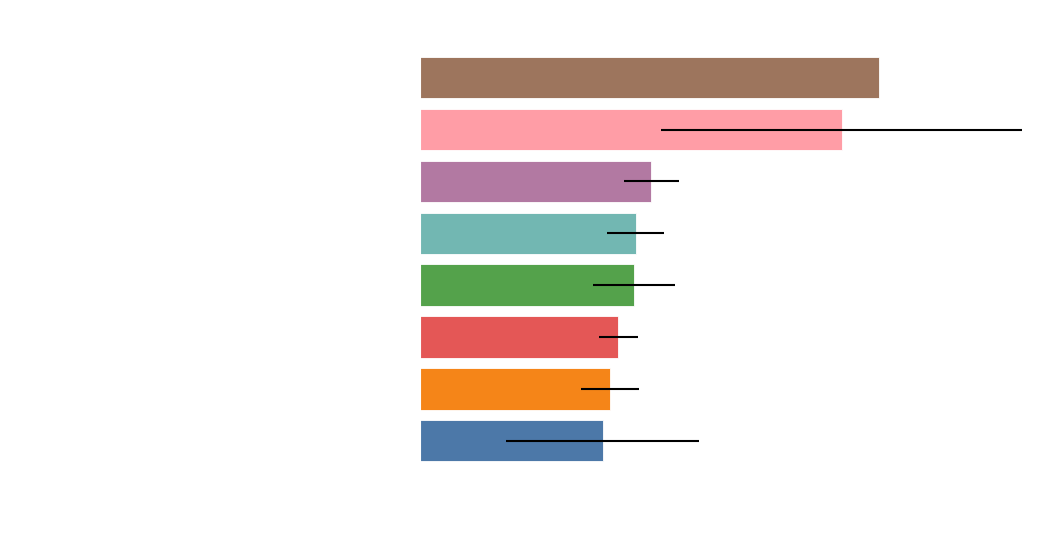
Top 100 risk drivers mapped to known pathways