Monitoring on AWS
Cloud Watch Metrics, Cloud Watch Alarms


Learning Outcome
5
Understand how alarms help in automation
4
Create basic alarm conditions
3
Explain what CloudWatch alarms are
2
Identify default AWS metrics
1
Understand what CloudWatch metrics are
Let’s recall what we already learned
CloudWatch monitors AWS resources
It collects metrics and logs
Monitoring helps maintain availability and reliability

Understanding the Concept
It shows temperature continuously and rings when temperature becomes too high.
Imagine a digital thermometer with an alarm feature.


Similarly, CloudWatch shows system performance using metrics and triggers alarms when limits are crossed

What are CloudWatch Metrics?
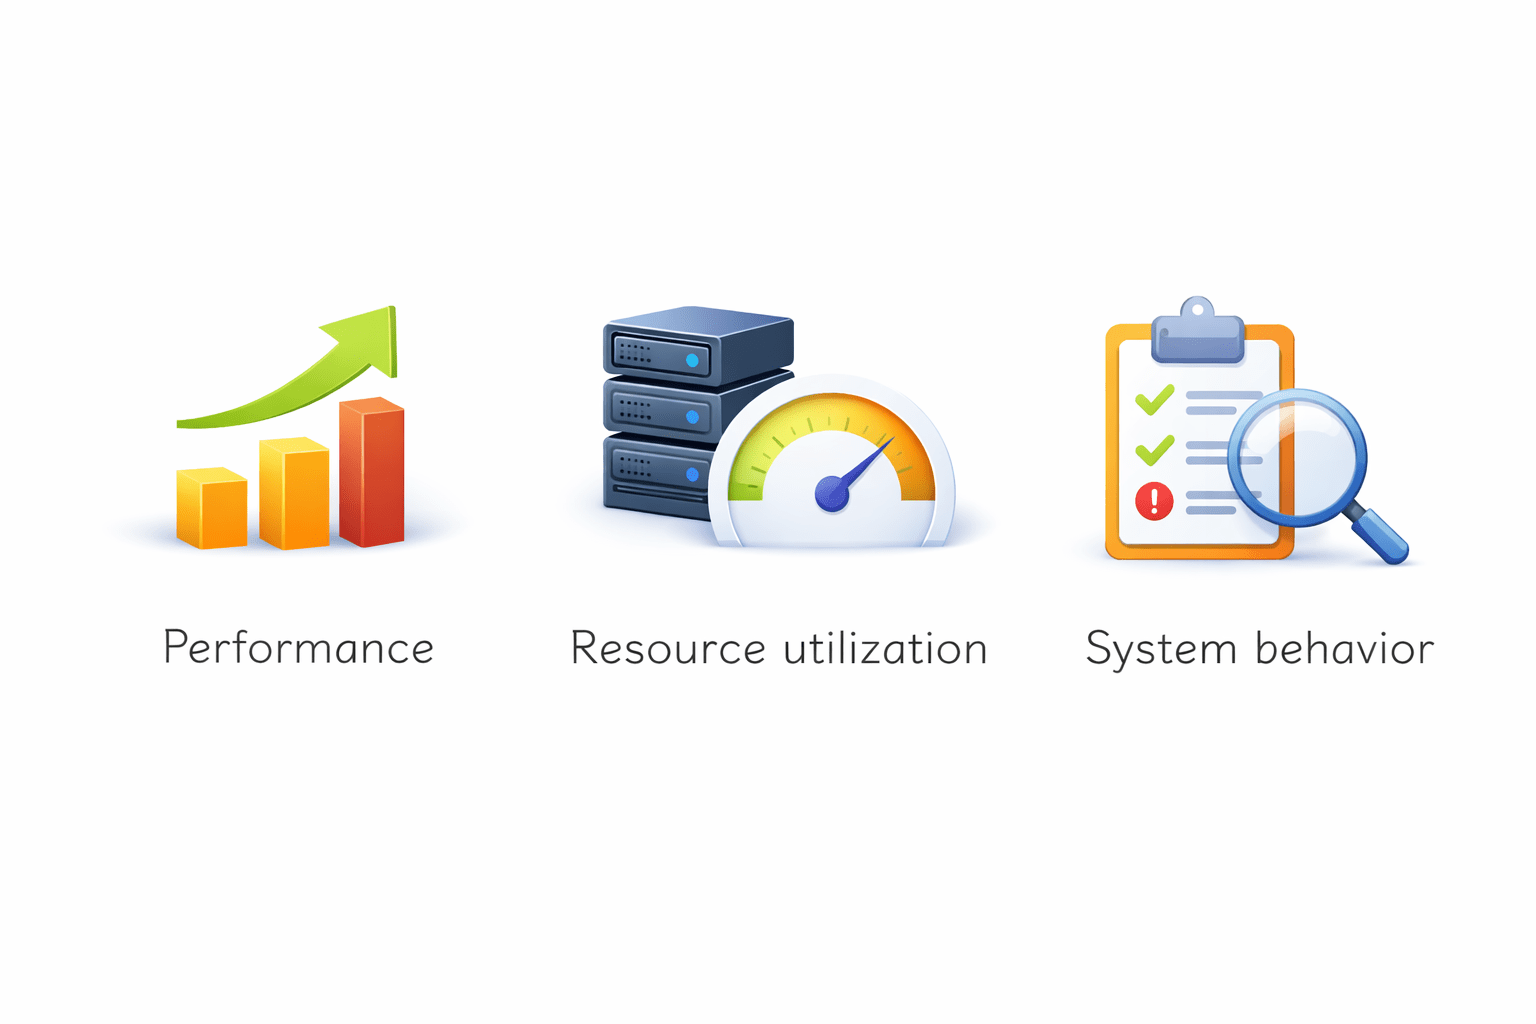
Amazon CloudWatch automatically collects numerical data from AWS resources
Performance Resource utilization System behavior
These numerical values are called metrics
Metrics represent:
Examples of Default Metrics
- Network Out
- CPU usage
For EC2 instance
For RDS
Disk Read/Write
CloudWatch automatically
collects these metrics

- CPU Utilization
- Network In
- Database connections
- Free storage space

Types of Metrics
- Automatically provided by AWS
- No additional setup required
- User-defined metrics
- Sent manually to CloudWatch
Default Metrics
Custom Metrics
Example: Business transactions
Example: EC2 CPU utilization

Important Metric Components
Timestamp
Each metric includes:

Metric name
Value
Dimensions
(instance ID, region)
Namespace
(Service name)

Why Metrics are Important?
Control cloud costs

Support capacity planning
Detect unusual behavior
Track system performance
What are CloudWatch Alarms?
CloudWatch alarms monitor metrics and perform actions when thresholds are crossed.
An alarm continuously checks a metric and changes state based on conditions.
Alarm States
-
OK – Metric is within safe limit
-
ALARM – Threshold exceeded
INSUFFICIENT_DATA – Not enough data
How CloudWatch Alarms Work
Step-by-step:
-
Select a metric (e.g., CPU Utilization)
-
Define threshold (e.g., > 80%)
-
Set evaluation period
-
Define action (send notification, trigger scaling)
Alarm Actions
When alarm triggers, it can:
-
Send notification (SNS)
-
Trigger Auto Scaling
-
Stop or terminate EC2 instance
Recover instance
Why Alarms are Important?
-
Provide automatic alerting
-
Reduce downtime
-
Enable automation
-
Improve reliability
Without alarms:
-
Teams must manually check dashboards
-
Problems may go unnoticed
Practical Example
Example Scenario:
-
EC2 CPU > 80% for 5 minutes
-
Alarm triggers
-
Auto Scaling launches new instance
Result:
System remains stable.
Key Points
-
Metrics are numerical performance data
-
Default metrics are automatic
-
Custom metrics require manual publishing
-
Alarms work based on thresholds
-
Alarm states: OK, ALARM, INSUFFICIENT_DATA
-
Alarm actions can automate responses
Summary
5
Essential for cloud reliability and automation
4
Alarms trigger notifications or automated actions
3
CloudWatch alarms monitor metrics
2
Default and custom metrics are supported
1
CloudWatch metrics track AWS resource performance
Quiz
What are CloudWatch metrics?
A. Log files
B. Numerical performance data of AWS resources
C. Source code files
D. Billing reports

Answer
What are CloudWatch metrics?
A. Log files
B. Numerical performance data of AWS resources
C. Source code files
D. Billing reports
