Standardize Data Using Z-Score and T-Score

Business Scenario

Welcome!
Today is your twelfth day as a Junior Data Analyst at a retail analytics company.
Retail businesses collect performance data from stores, products, sales representatives, customer reviews, and marketing campaigns. However, these values are often measured on different scales. For example, one product may have 500 reviews while another has 50 reviews. Similarly, one sales representative may have 15 years of experience while another has only 2 years.
Pre-Lab Preparation
Click here to download previous lab file: DM LAB 11
Topic: Decoding Your Data
1) Unlocking the World of Probability
2) Balancing Data: Understanding Uniform Distribution
3) The Binary World of Binomial Distribution
To make informed business decisions, analysts use Data Standardization Techniques to measure how far a value is from the average and compare observations across different datasets.

Git Pull
git pull origin branchNameClick to download Dataset : Retail_Dataset_Cleaned
Task 1: The Z-Score Journey
In retail businesses, analysts often compare product reviews, sales performance, customer satisfaction scores, and inventory levels. Since these values may have different ranges, direct comparison becomes difficult.
Therefore, analysts use Z-Score to understand how far a particular value is from the average performance of the dataset.

What is Z-Score?
A Z-Score is a statistical measure that indicates how many standard deviations a data value is above or below the mean.
Formula :
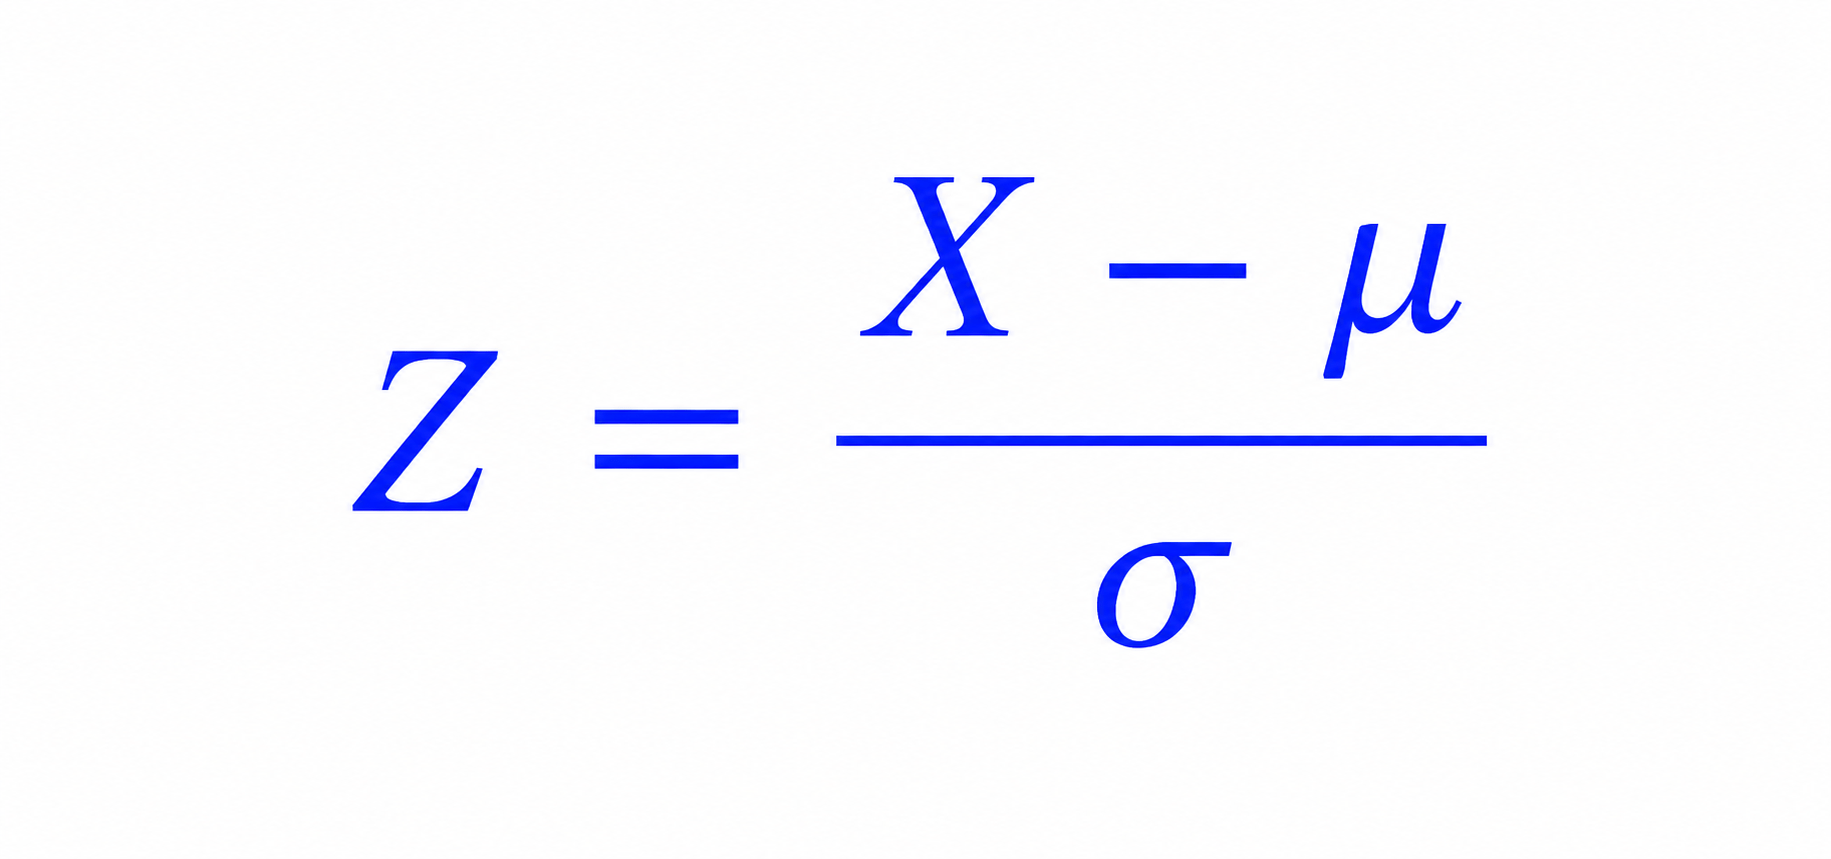
Where:
- X = Individual value
- μ = Mean
- σ = Standard Deviation
Interpretation
-
Z = 0 → Value is exactly at the mean
-
Z > 0 → Value is above the mean
-
Z < 0 → Value is below the mean
Open Google Colab
1
2
Import Required Libraries
import pandas as pd
import numpy as np
import matplotlib.pyplot as plt
from scipy.stats import zscore
3
Upload the Retail Dataset
4
Load Dataset Using Pandas
df = pd.read_csv("/content/Retail_Dataset_Modified.csv")

print("Dataset Loaded Successfully")
scipy.stats is a module from the SciPy library that provides statistical functions such as:
- Mean calculations
- Probability distributions
- Hypothesis testing
- Correlation analysis
- Z-Score calculation
Display First Five Records
5
df.head()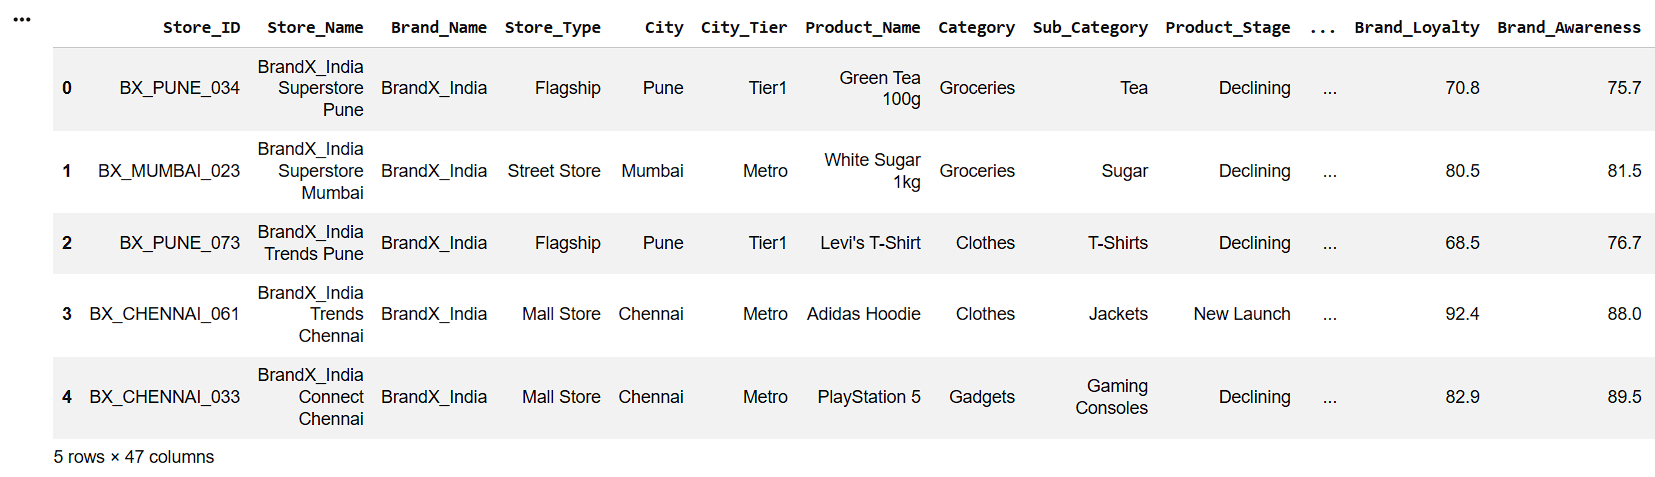
6
Check Dataset Information
df.info()7
Display Column Names
df.columns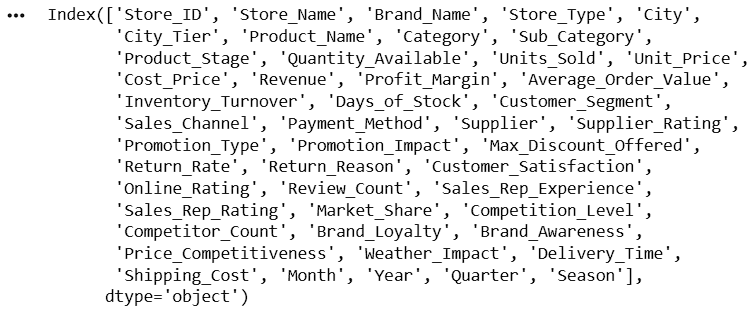
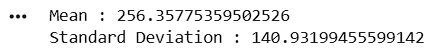
Select Review Count Column
review_count = df["Review_Count"]Calculate Mean and Standard Deviation
mean_review = review_count.mean()
std_review = review_count.std()
print("Mean :", mean_review)
print("Standard Deviation :", std_review)
8
9
8
Calculate Z-Scores
df["Z_Score"] = zscore(review_count)

df[["Review_Count","Z_Score"]].head()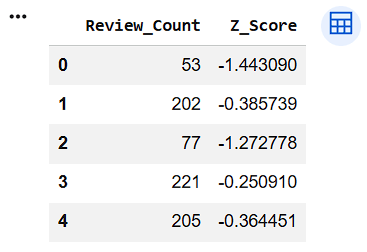
Display Highest Z-Score Records
10
11
8
top_reviews = df[["Review_Count","Z_Score"]].sort_values(
    by="Z_Score",
    ascending=False
)
top_reviews.head(10)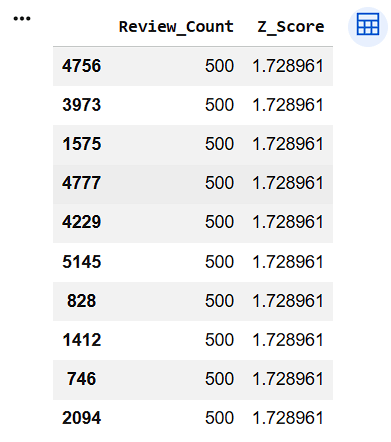
Visualize Z-Score Distribution
12
plt.figure(figsize=(10,5))

plt.hist(df["Z_Score"], bins=20)

plt.title("Z-Score Distribution")

plt.xlabel("Z-Score")

plt.ylabel("Frequency")

plt.show()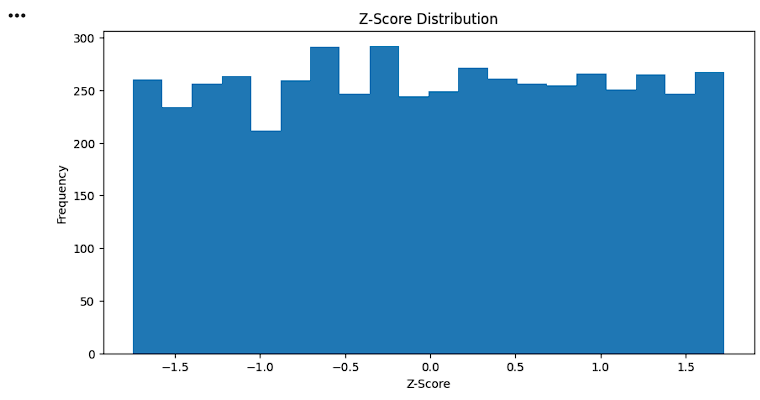
Identify Outliers
outliers = df[
(df["Z_Score"] > 3) |
(df["Z_Score"] < -3)]
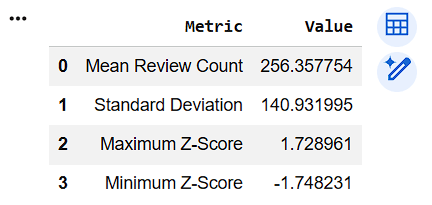
outliers[["Review_Count","Z_Score"]].head()Create Z-Score Summary Table
zscore_summary = pd.DataFrame({
    "Metric":[
        "Mean Review Count",
        "Standard Deviation",
        "Maximum Z-Score",
        "Minimum Z-Score"],
    "Value":[
        review_count.mean(),
        review_count.std(),
        df["Z_Score"].max(),
        df["Z_Score"].min()
    ]
})
zscore_summary
13
8
14
8
Task 2: The T-Score
In retail businesses, managers often compare the performance of products, stores, and customer satisfaction scores. However, Z-Scores sometimes contain negative values and decimal numbers, which may be difficult for business users to understand.
For example:
- Product A has a Z-Score of -1.5
- Product B has a Z-Score of 0.8
- Product C has a Z-Score of 2.1
Managers may not immediately understand what these numbers represent.
Therefore, analysts convert Z-Scores into T-Scores, which use an easy-to-understand scale:
- Average Score = 50
- Above Average = More than 50
- Below Average = Less than 50
This makes business reporting and performance comparison simpler.
What is T-Score?
A T-Score is a standardized score obtained by converting a Z-Score into a new scale with:
- Mean = 50
- Standard Deviation = 10
Formula
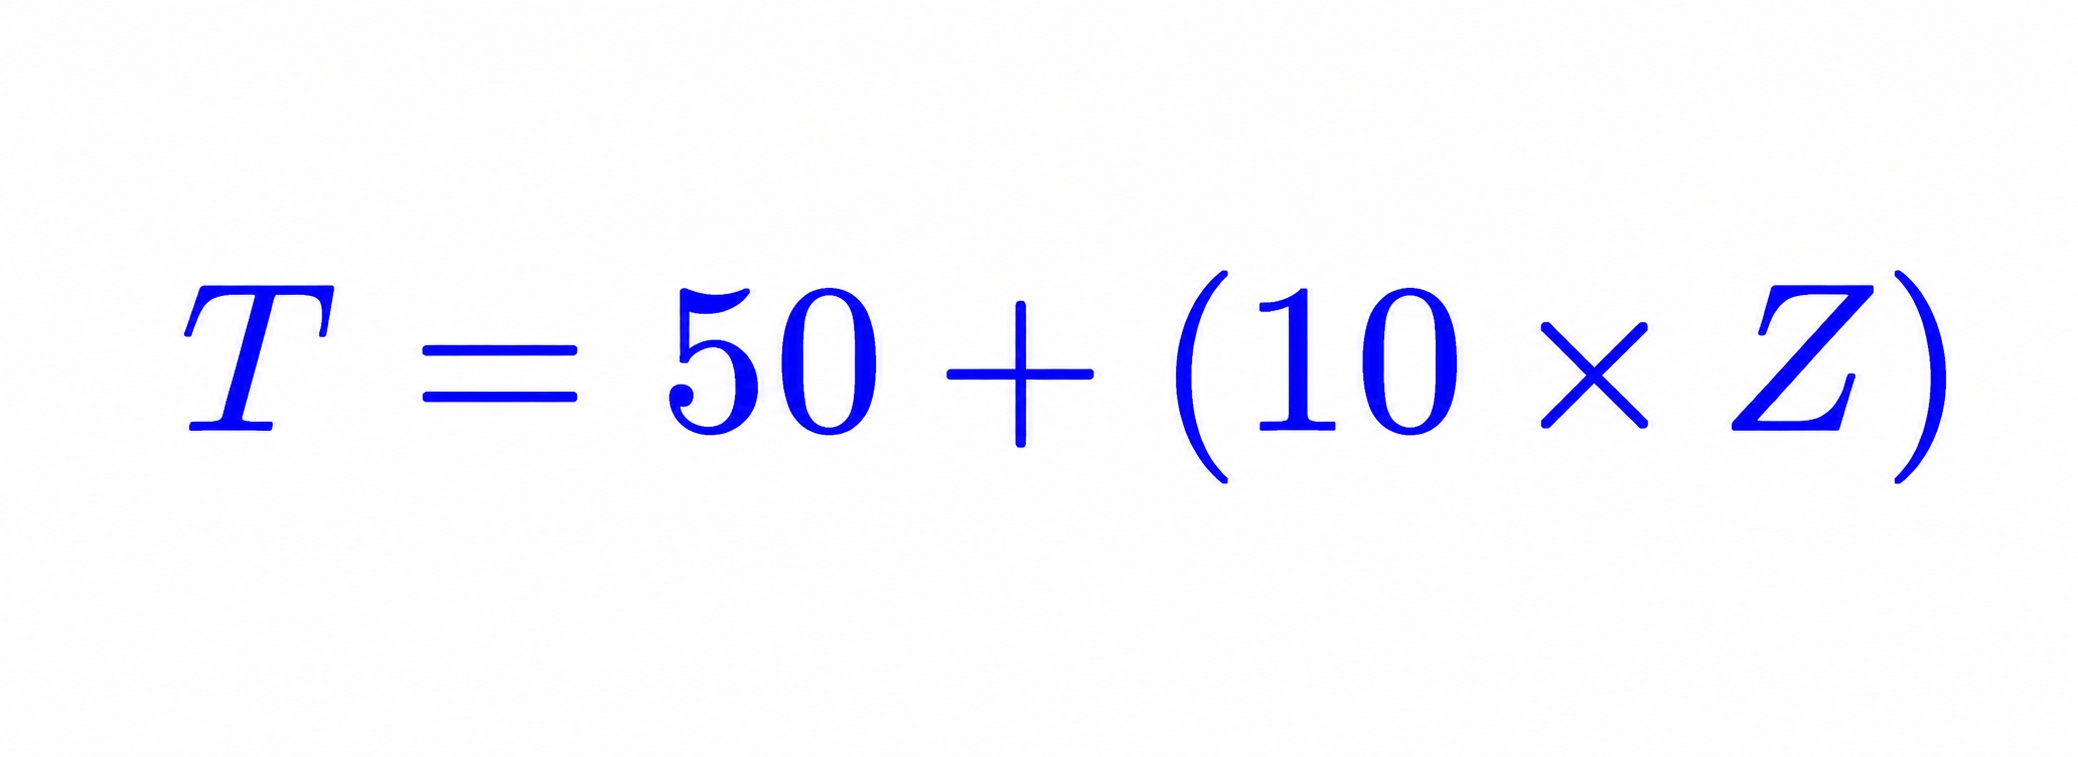
Where:
- T = T-Score
- Z = Z-Score
Why do we multiply by 10?
Multiplying by 10 creates a standard deviation of 10.
Why do we add 50?
Adding 50 shifts the average score to 50.

Select Customer Satisfaction Column
customer_satisfaction = df["Customer_Satisfaction"]Calculate Z-Scores
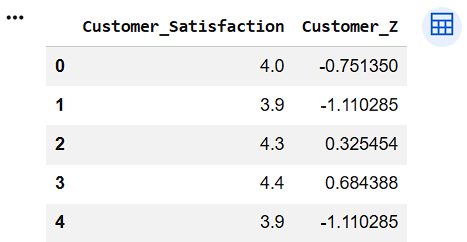
df["Customer_Z"] = zscore(customer_satisfaction)
df[["Customer_Satisfaction","Customer_Z"]].head()
1
2
Convert Z-Scores to T-Scores
df["T_Score"] = 50 + (10 * df["Customer_Z"])
df[["Customer_Satisfaction","T_Score"]].head()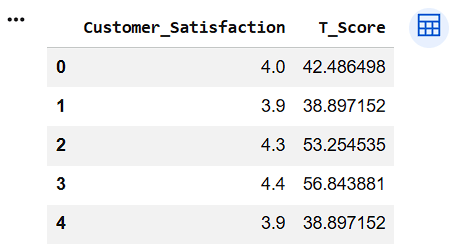
Display T-Score Table
3
4
df[[
    "Customer_Satisfaction",
    "Customer_Z",
    "T_Score"
]].head()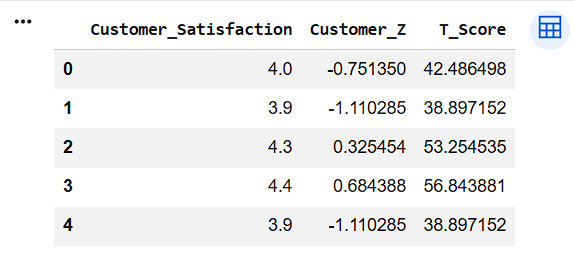
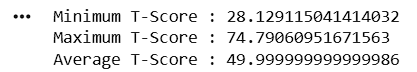
Display T-Score Information
print("Minimum T-Score :", df["T_Score"].min())

print("Maximum T-Score :", df["T_Score"].max())

print("Average T-Score :", df["T_Score"].mean())
5
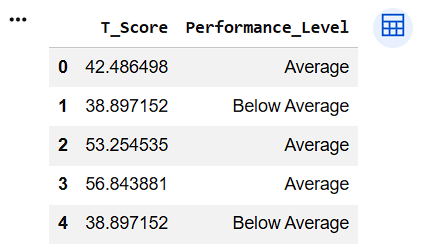
Categorize T-Scores
conditions = [
    df["T_Score"] < 40,
    (df["T_Score"] >= 40) & (df["T_Score"] <= 60),
    df["T_Score"] > 60
]
labels = [
    "Below Average",
    "Average",
    "Above Average"
]
df["Performance_Level"] = np.select(
    conditions,
    labels,
    default="Average"
)
df[["T_Score","Performance_Level"]].head()
6
4
Count Performance Levels
performance_count = df[
    "Performance_Level"
].value_counts()

performance_count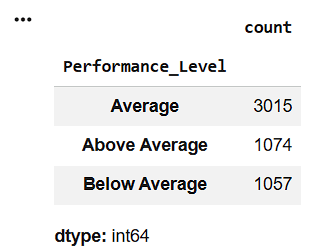
7
Visualize Performance Categories
performance_count.plot(
    kind="bar"
)
plt.title("Performance Levels Based on T-Score")
plt.xlabel("Performance Level")
plt.ylabel("Count")
plt.show()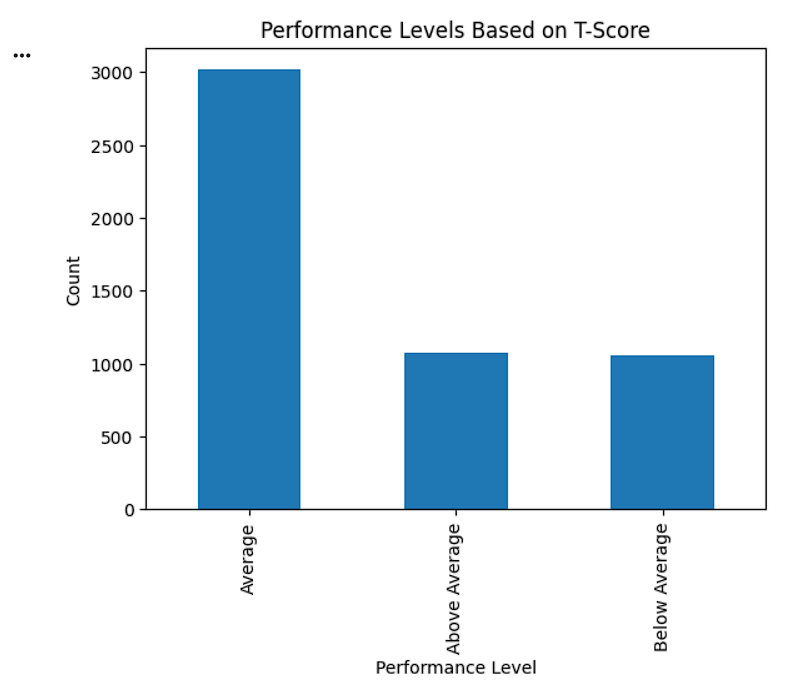
8
Great job!
You have successfully completed your lab on Standardize Data Using Z-Score and T-Score. In this lab, you have: Understood the concept of Z-Score, Standardized retail data using Z-Score, Identified observations above and below average, Converted Z-Scores into T-Scores, Compared retail performance using a common scale
You are now ready to move to the next stage of Junior Data Analyst.
Checkpoint
Git Push
git push origin branchNameNext-Lab Preparation
Topic: Data Manipulation with Pandas
1) Unlocking Pivot Table Techniques