
Pivot Tables for Funnel & Campaign Analysis
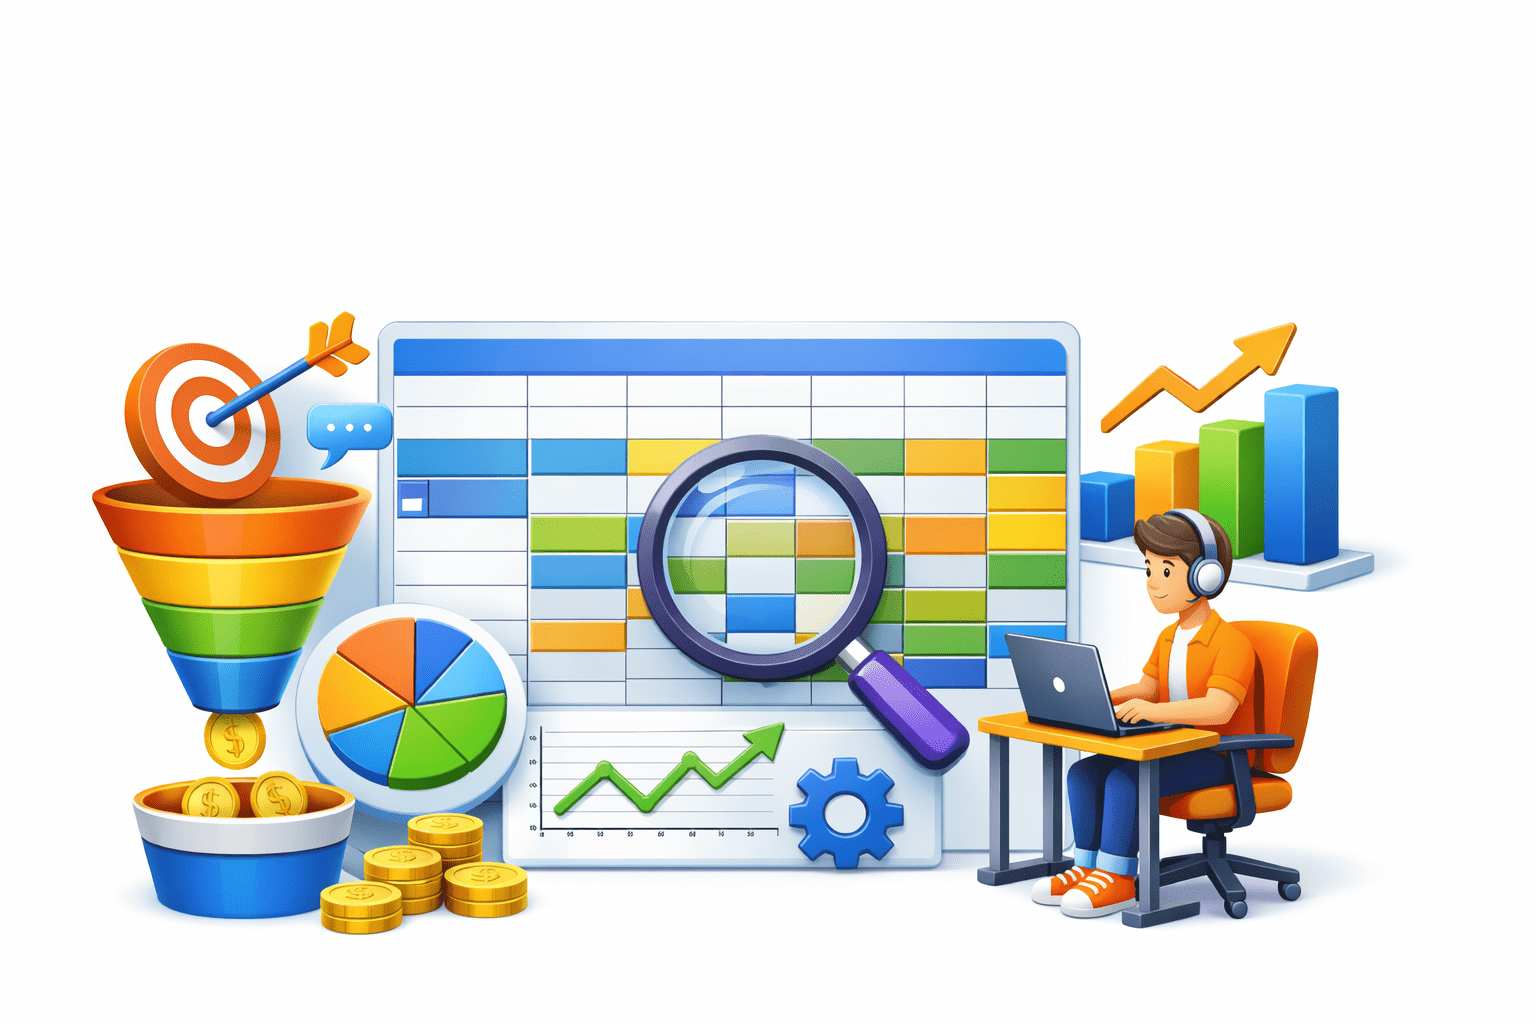
Excel For Digital Marketing

Learning Outcome
6
Apply pivot tables for decision-making and optimisation
5
Use slicers for interactive analysis
4
Understand key marketing metrics using pivot tables
3
Create pivot tables to summarise campaign performance
2
Learn how to analyse marketing funnel stages using data
1
Understand the role of pivot tables in campaign analysis
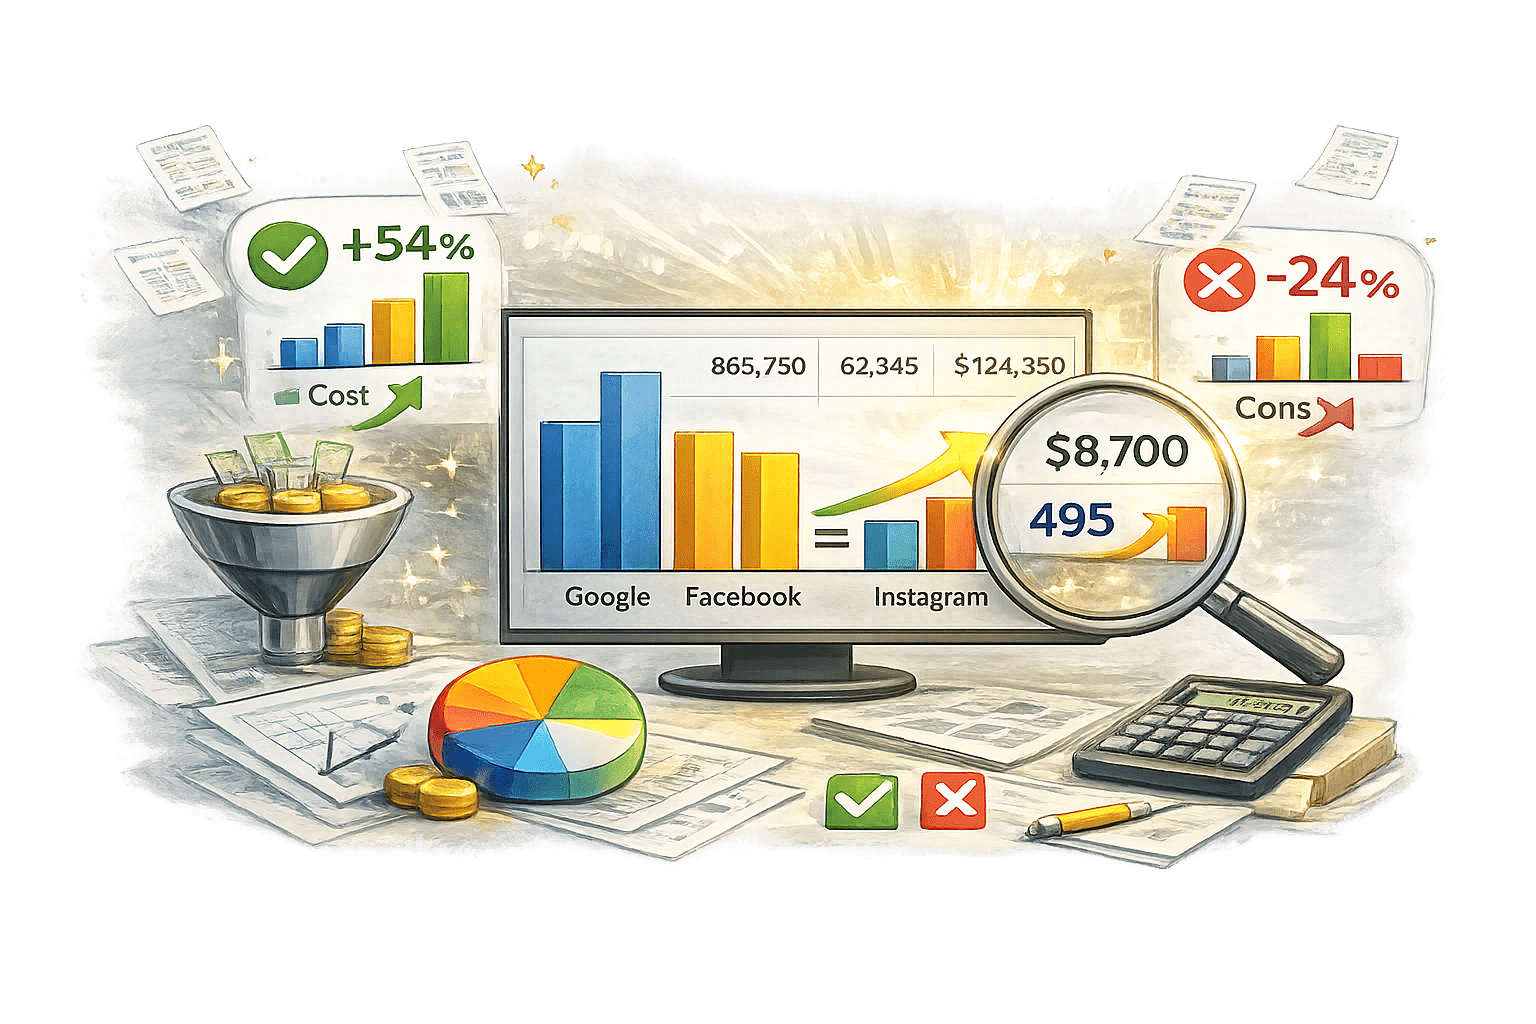
Marketing Data Overload
A digital marketer receives thousands of rows of campaign data from multiple platforms.
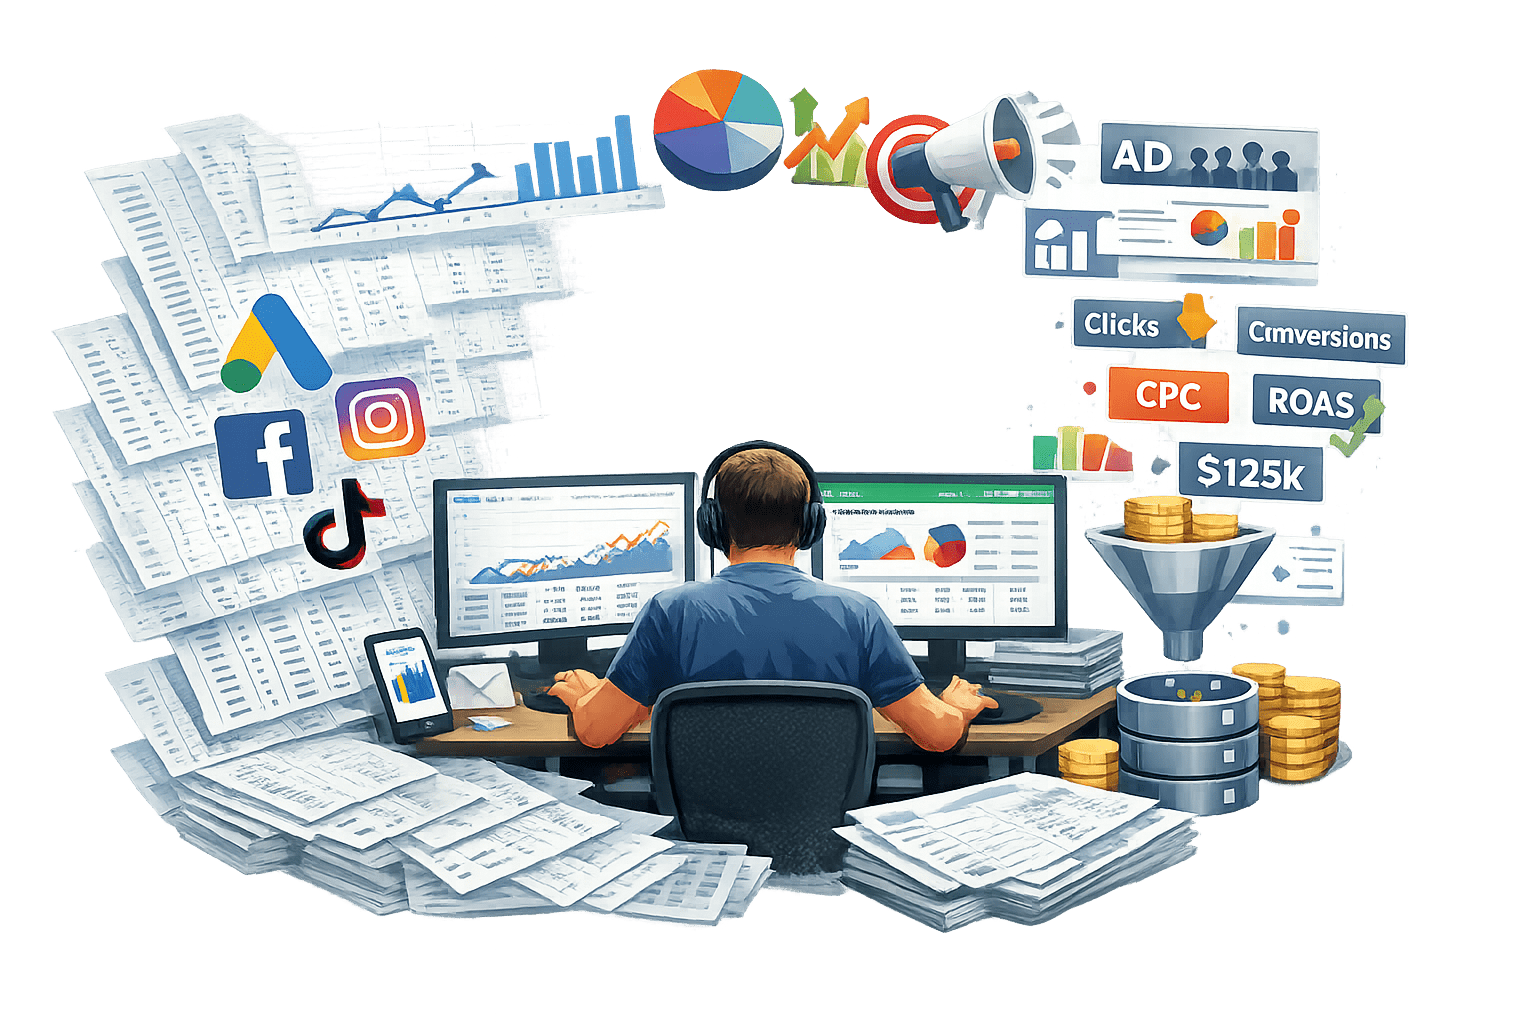
Manually analyzing this data is time consuming and confusing

Marketing Data Overload

Pivot tables help by:
Summarizing data instantly
Highlighting key
insights
Making comparisons easier


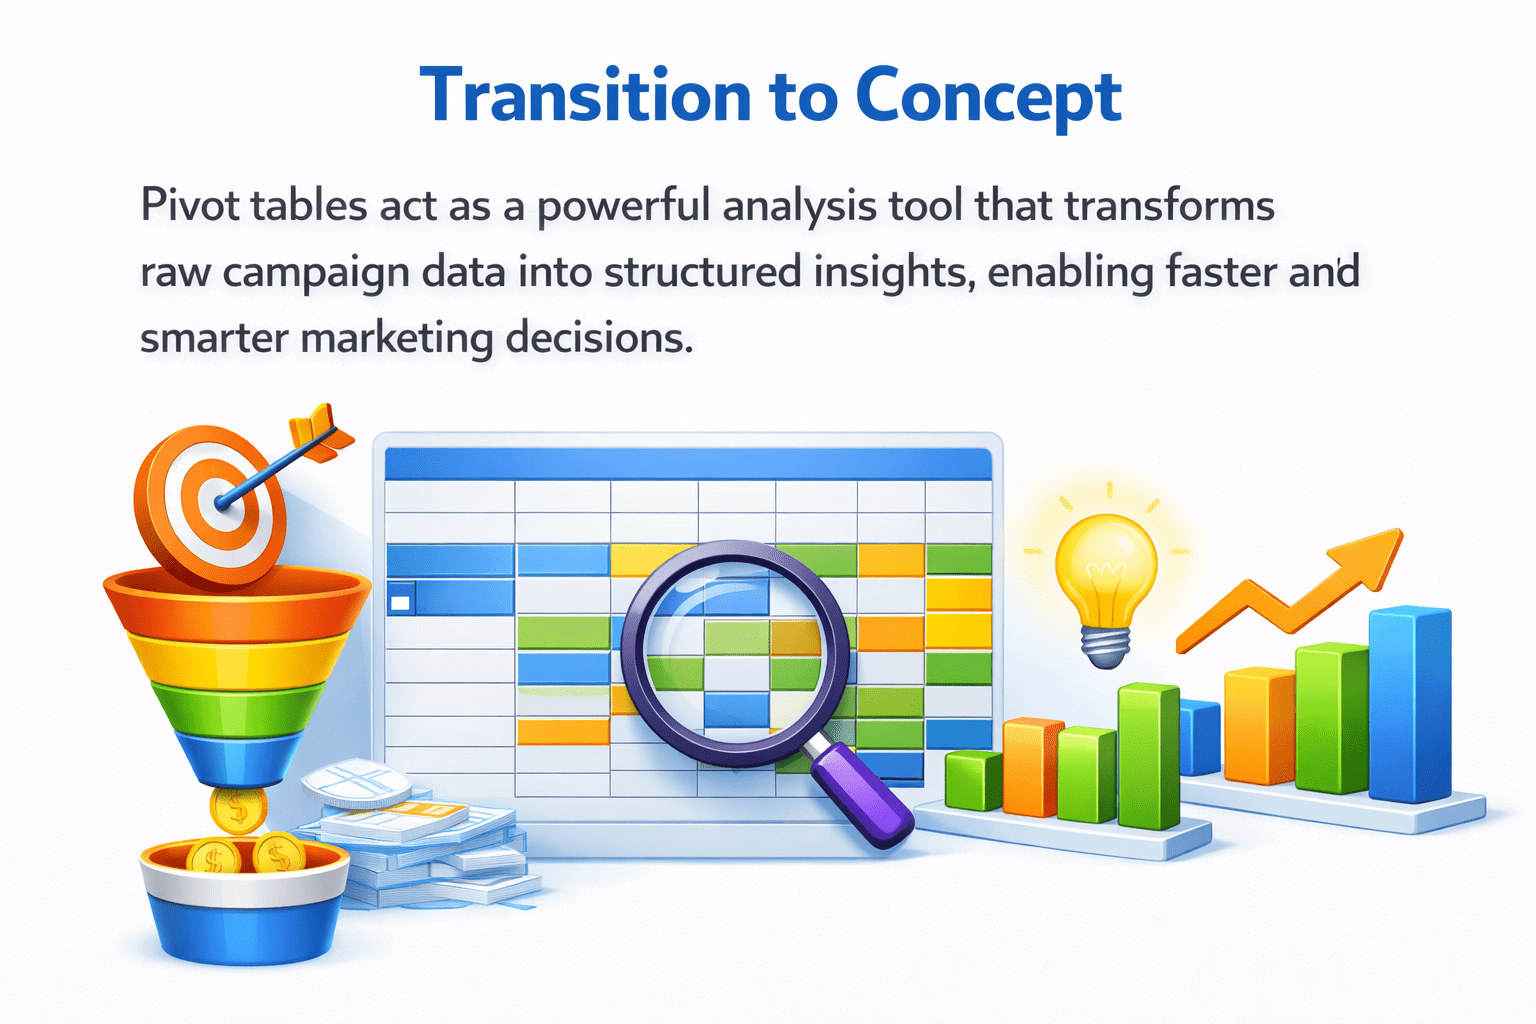
Pivot tables act as a powerful analysis tool that transforms raw campaign data into...
enabling faster and smarter marketing decisions

Structured insights

Digital Marketing Funnel Stages
Consideration
Clicks and website visits

02
Conversion
Purchases, sign-ups

03
Retention
Repeat customers and loyalty

04
Understanding the funnel helps track customer journey and campaign effectiveness.
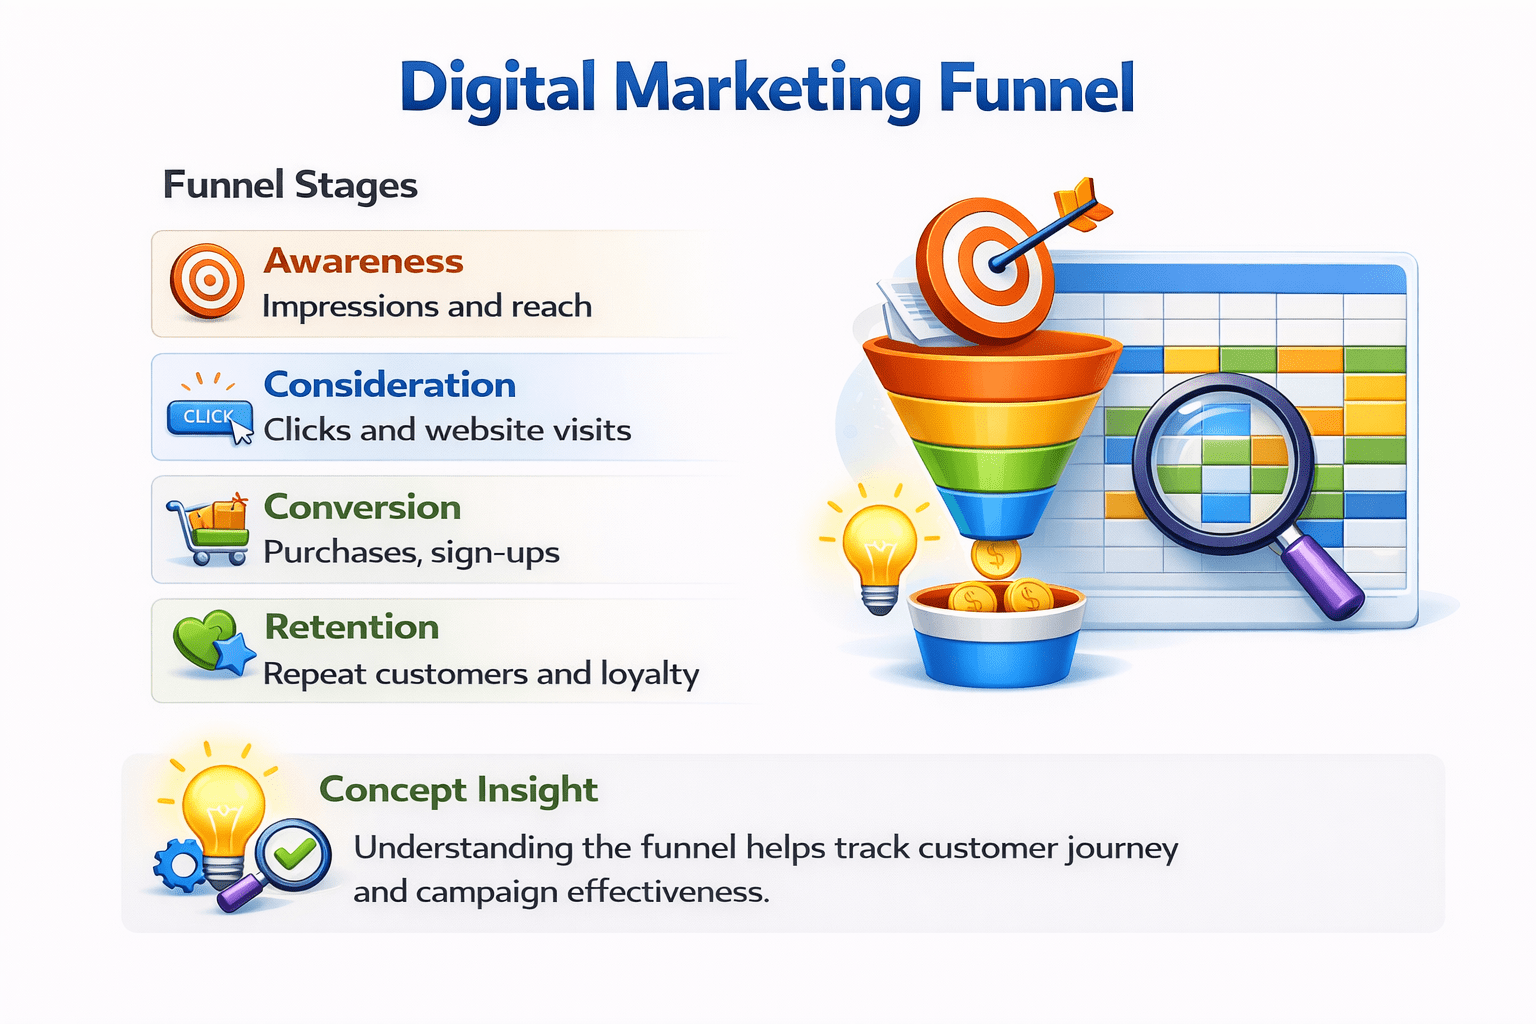
Impressions and reach

Awareness
Impressions and reach
01
Benefits of Pivot Tables
Create customised views
(by channel, campaign, region)
Compare campaigns easily

Track funnel performance


Summarize large datasets quickly
Pivot tables convert complex data into actionable insights without advanced tools.

Key Campaign Metrics
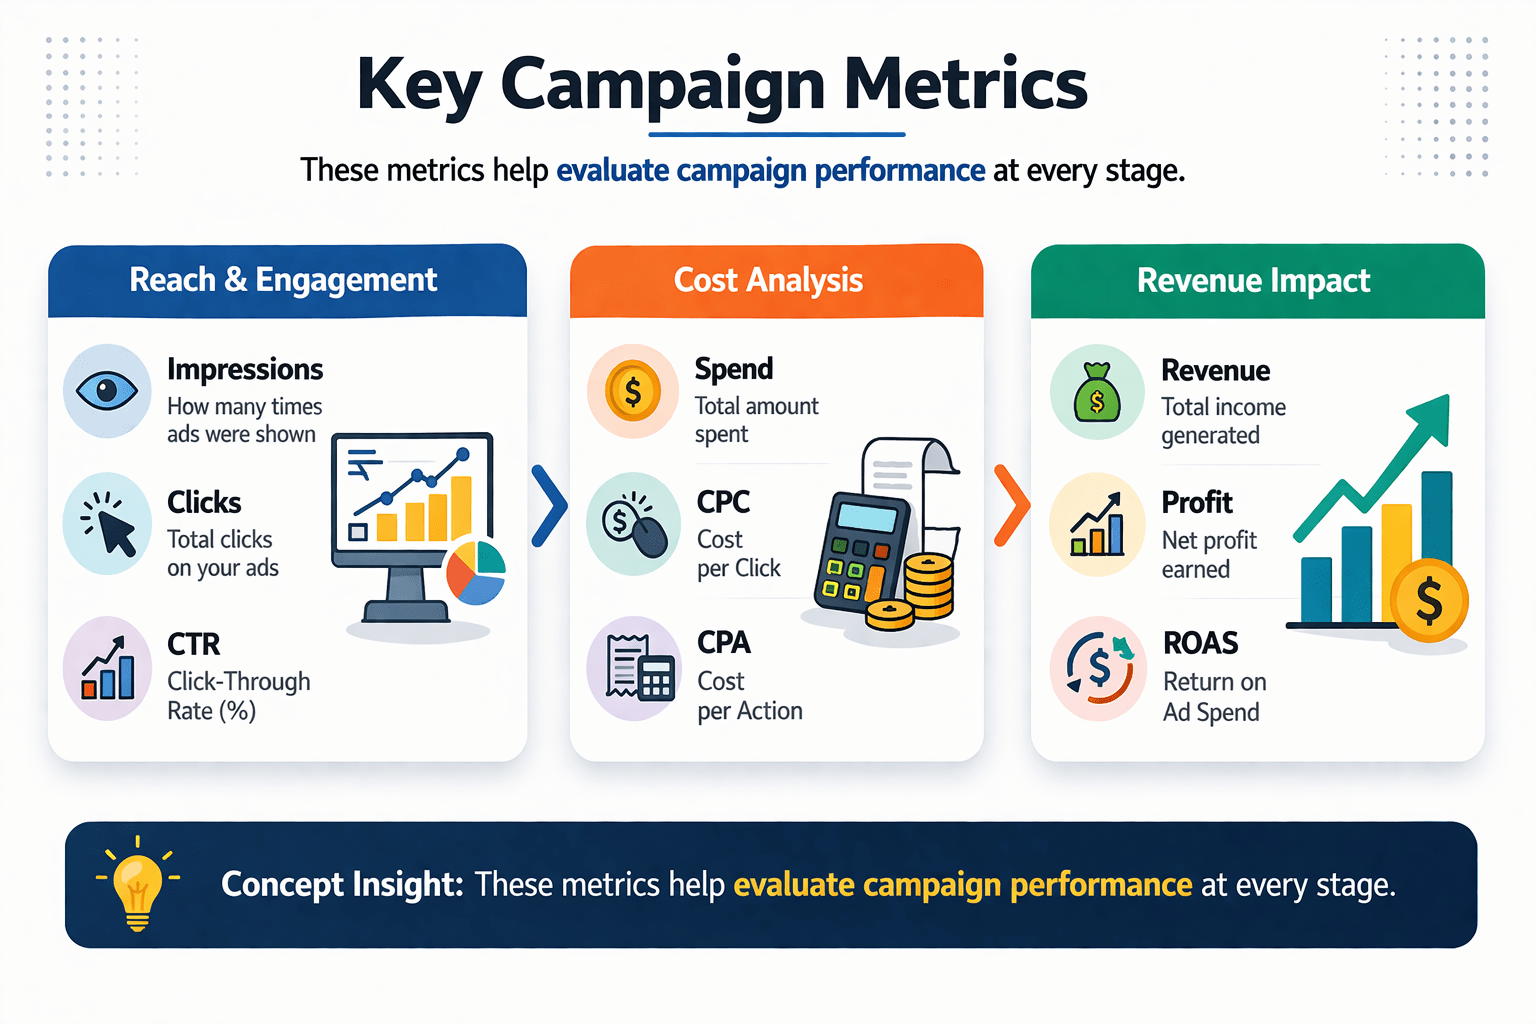
Reach & Engagement
Impressions
Clicks
CTR
Cost Analysis
Spend
CPC
CPA
Revenue Impact
Revenue
Profit
ROAS
Concept Insight
These metrics help evaluate campaign performance at every stage.


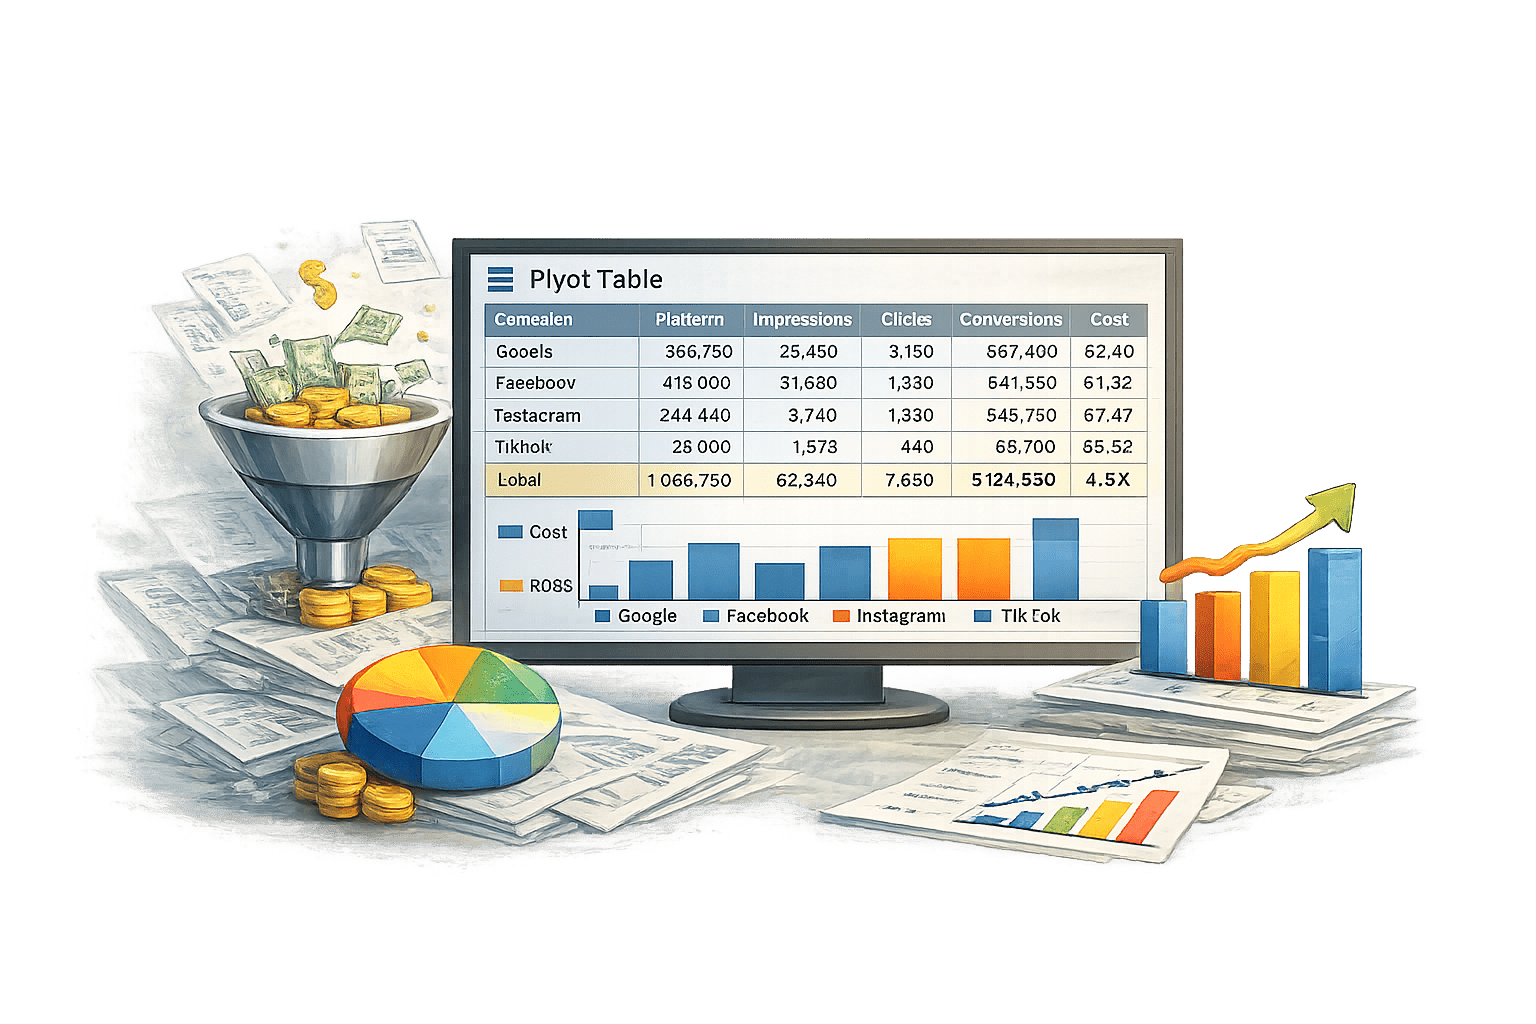
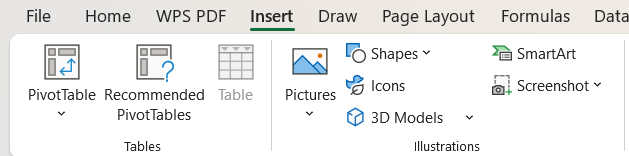
Creating a Pivot Table
select table, click the insert tab, and choose "Pivot Table"
Select data and insert Pivot Table
02
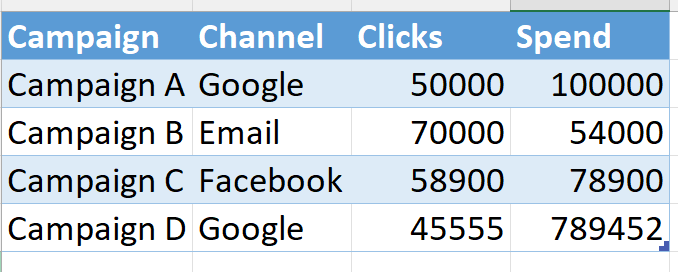
Sample dataset
Ensure the data is well-organized, with clear columns for each metric.
Prepare dataset
01
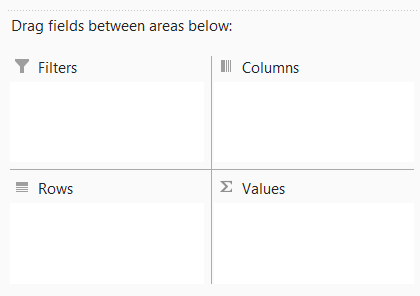
Creating a Pivot Table
Select and drag fields to the rows, columns, values, and filters areas to arrange and display the data.
Use field pane to organise data
04
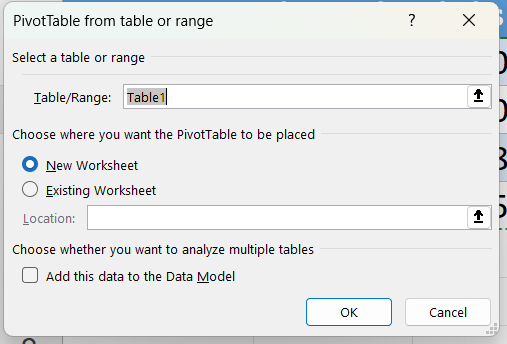
- choose "New Worksheet" as the location to insert the Pivot Table, then click "OK"
Place Pivot Table in new worksheet
03
Understanding Pivot Table Structure
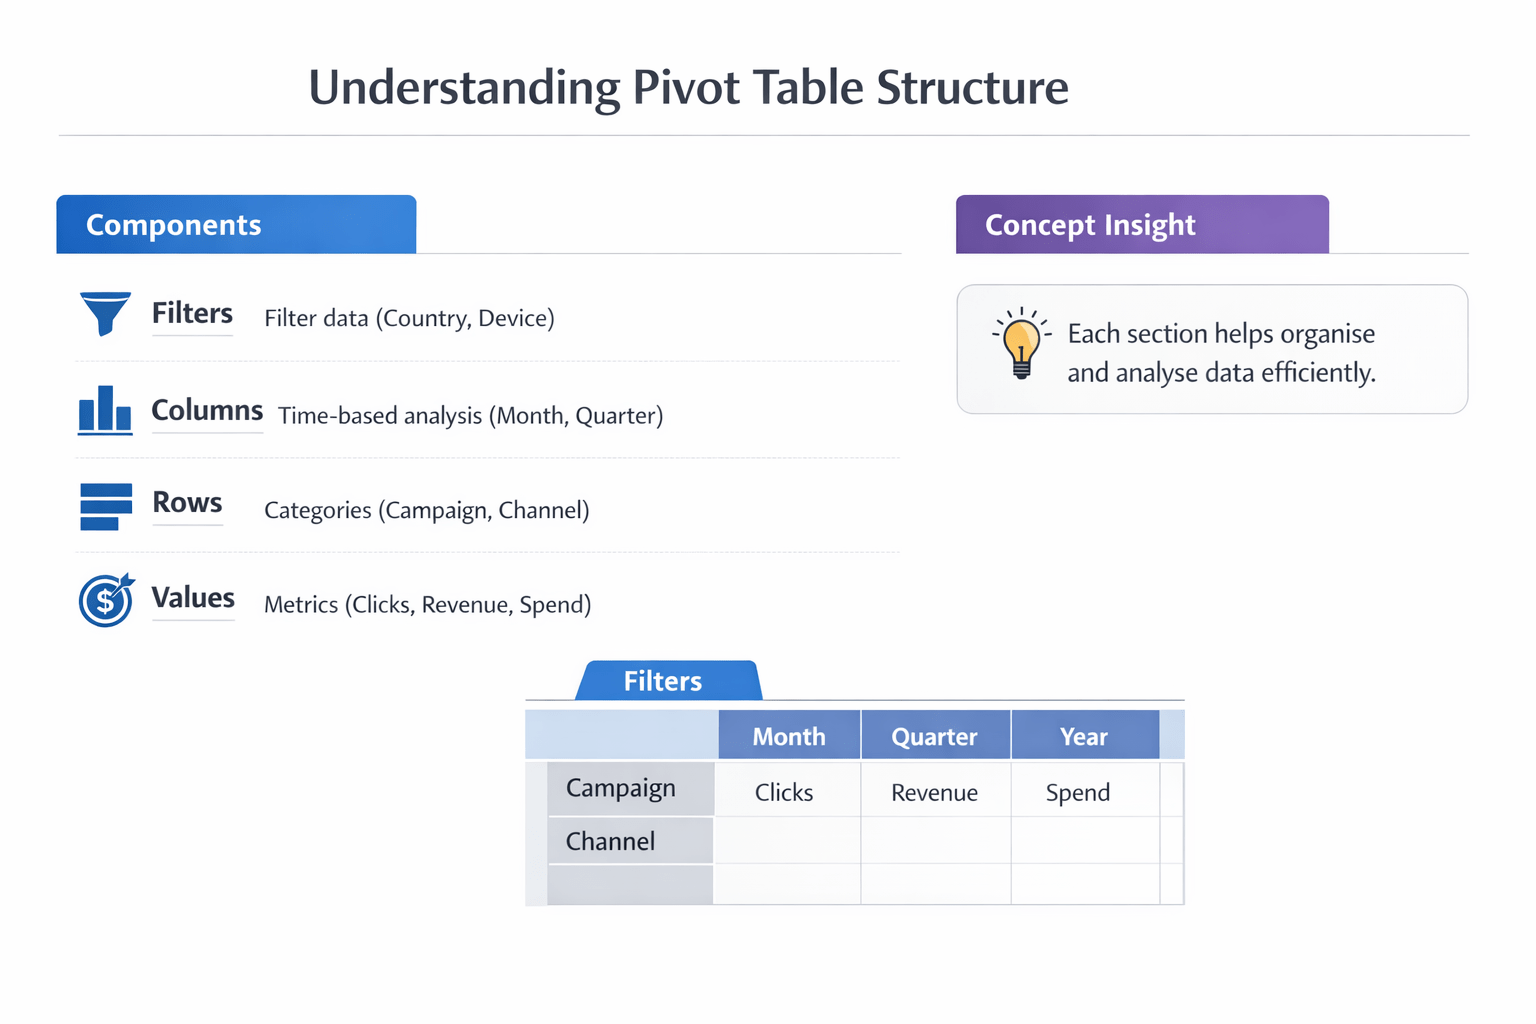
Components :

Columns:
Time-based analysis (Month, Quarter)

Rows:
Categories (Campaign, Channel)

Values:
Metrics (Clicks, Revenue, Spend)

Filters:

Filter data (Country, Device)
Using Slicers for Analysis

Add interactive filters
Easily switch between segments
Connect multiple pivot tables


Features
Use Cases
Filter by channel(Google, FB)
Filter by region or device
Create dashboard


Using Slicers for Analysis


Slicers make pivot tables interactive and presentation-ready.

Channels


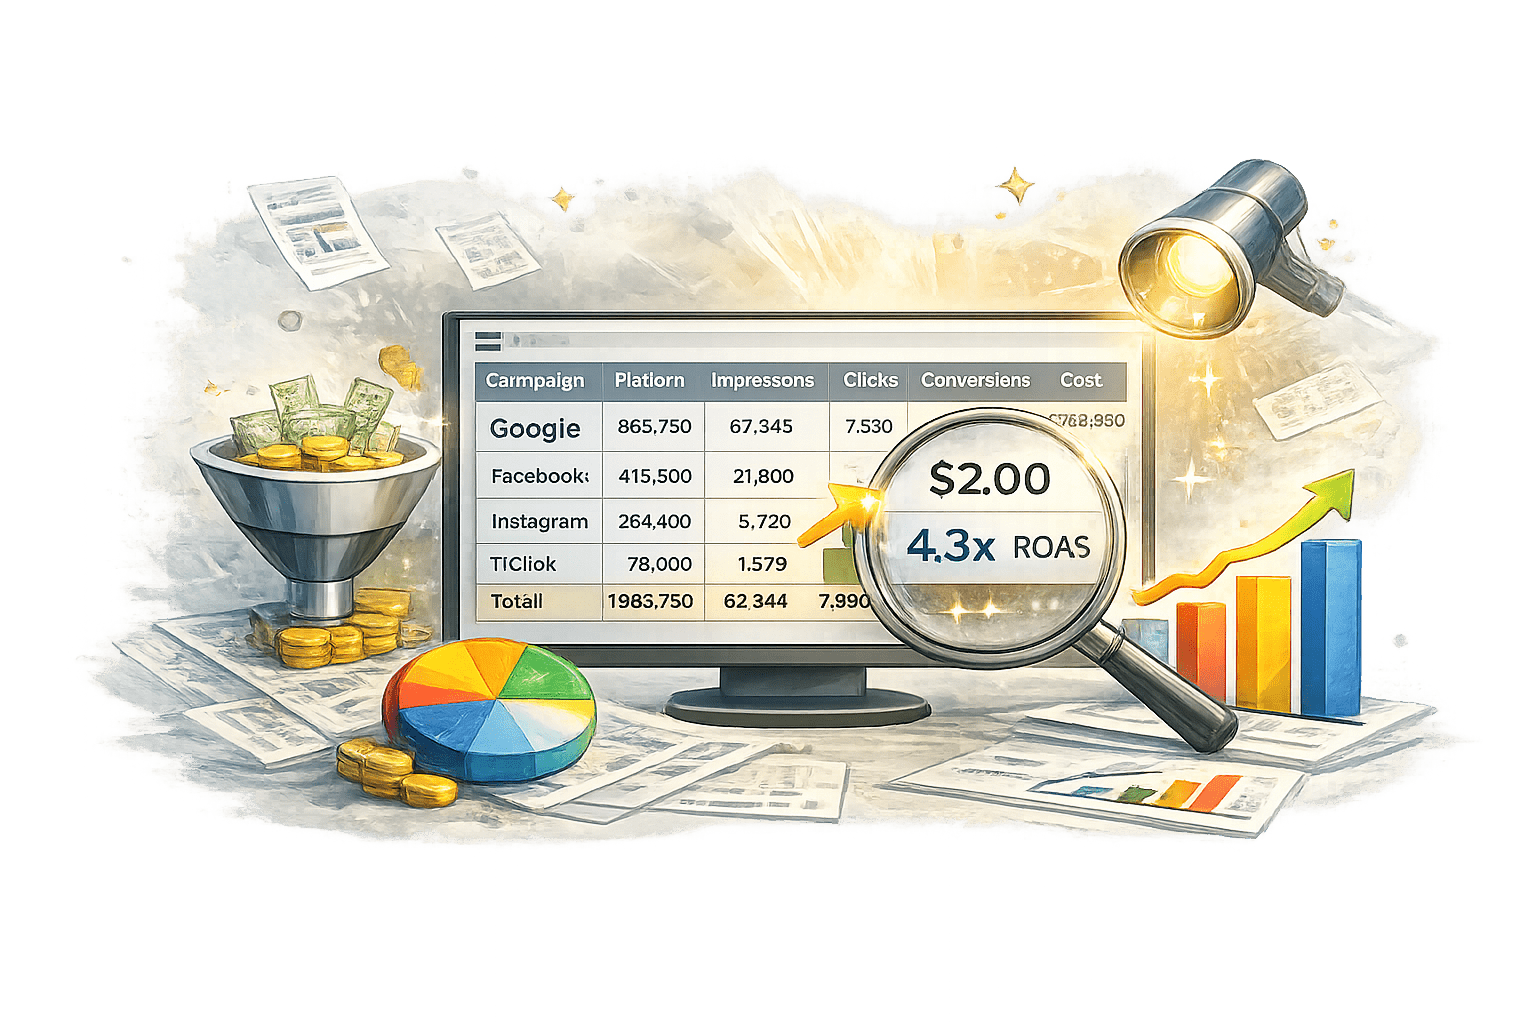
Questions Pivot Tables Can Answer
Key Questions
Which campaign has the highest ROI?
Which channel has the lowest CPA?

Are there seasonal trends?

Which creatives perform best?

Pivot tables help answer critical business questions quickly.
Funnel Analysis Using Pivot Tables
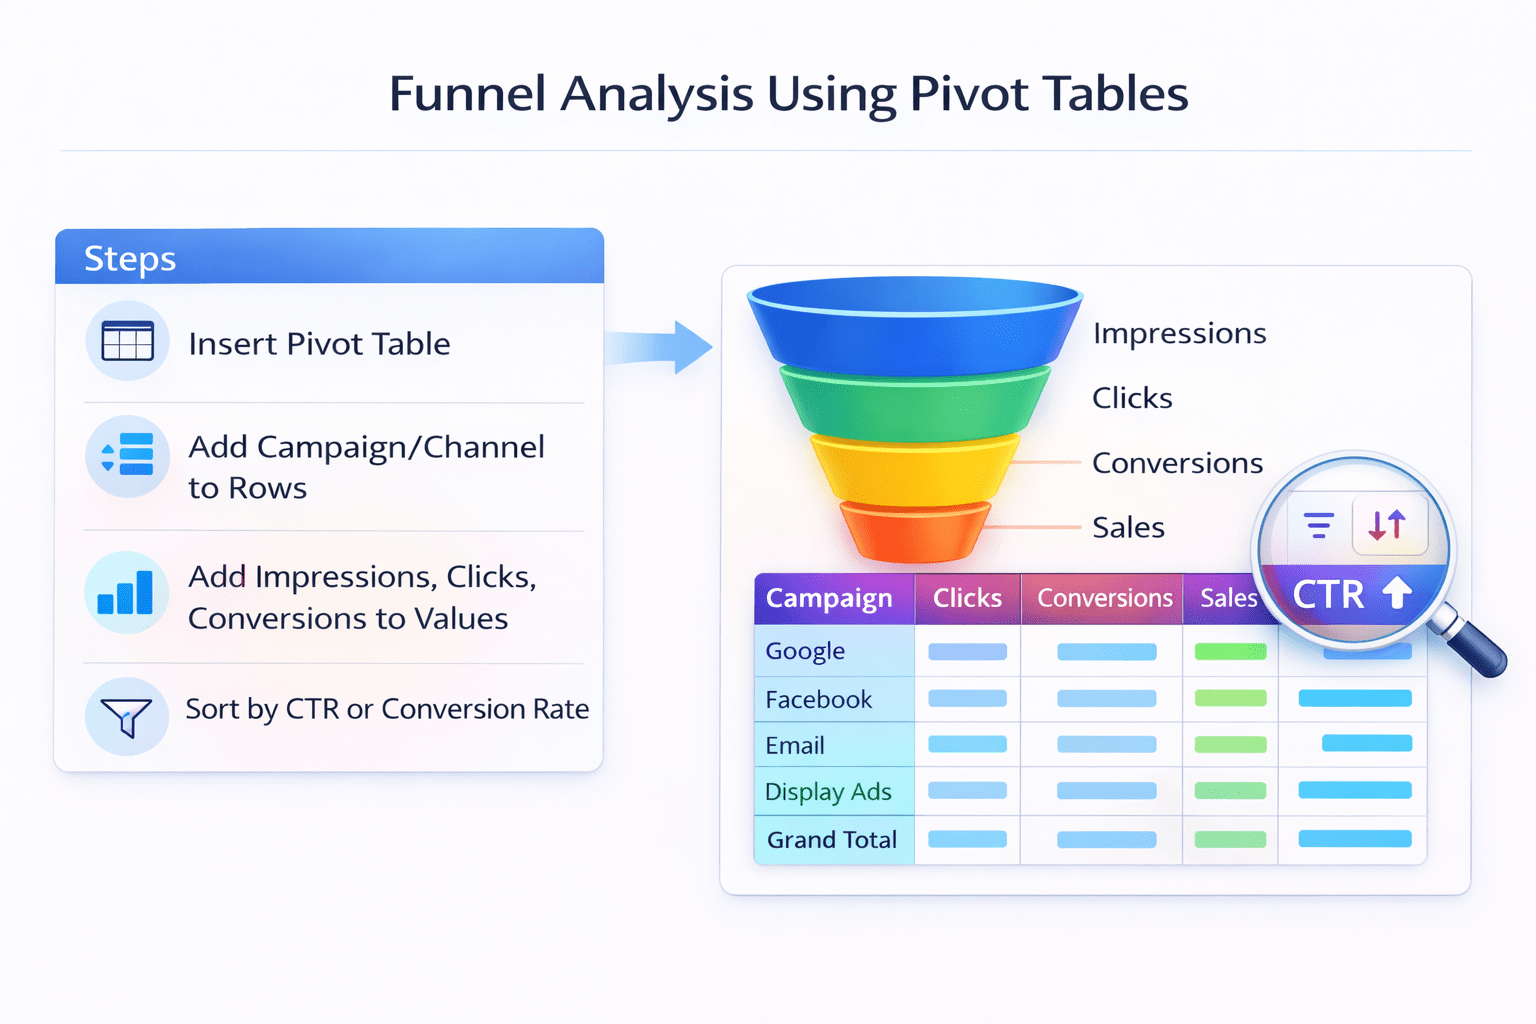
Steps:-
Insert Pivot Table

Add Campaign/Channel
to Rows

Add Impressions, Clicks,
Conversions to values

Sort by CTR or Conversion
Rate

Benefits of Pivot Tables in Marketing
Advantages
Faster Analysis
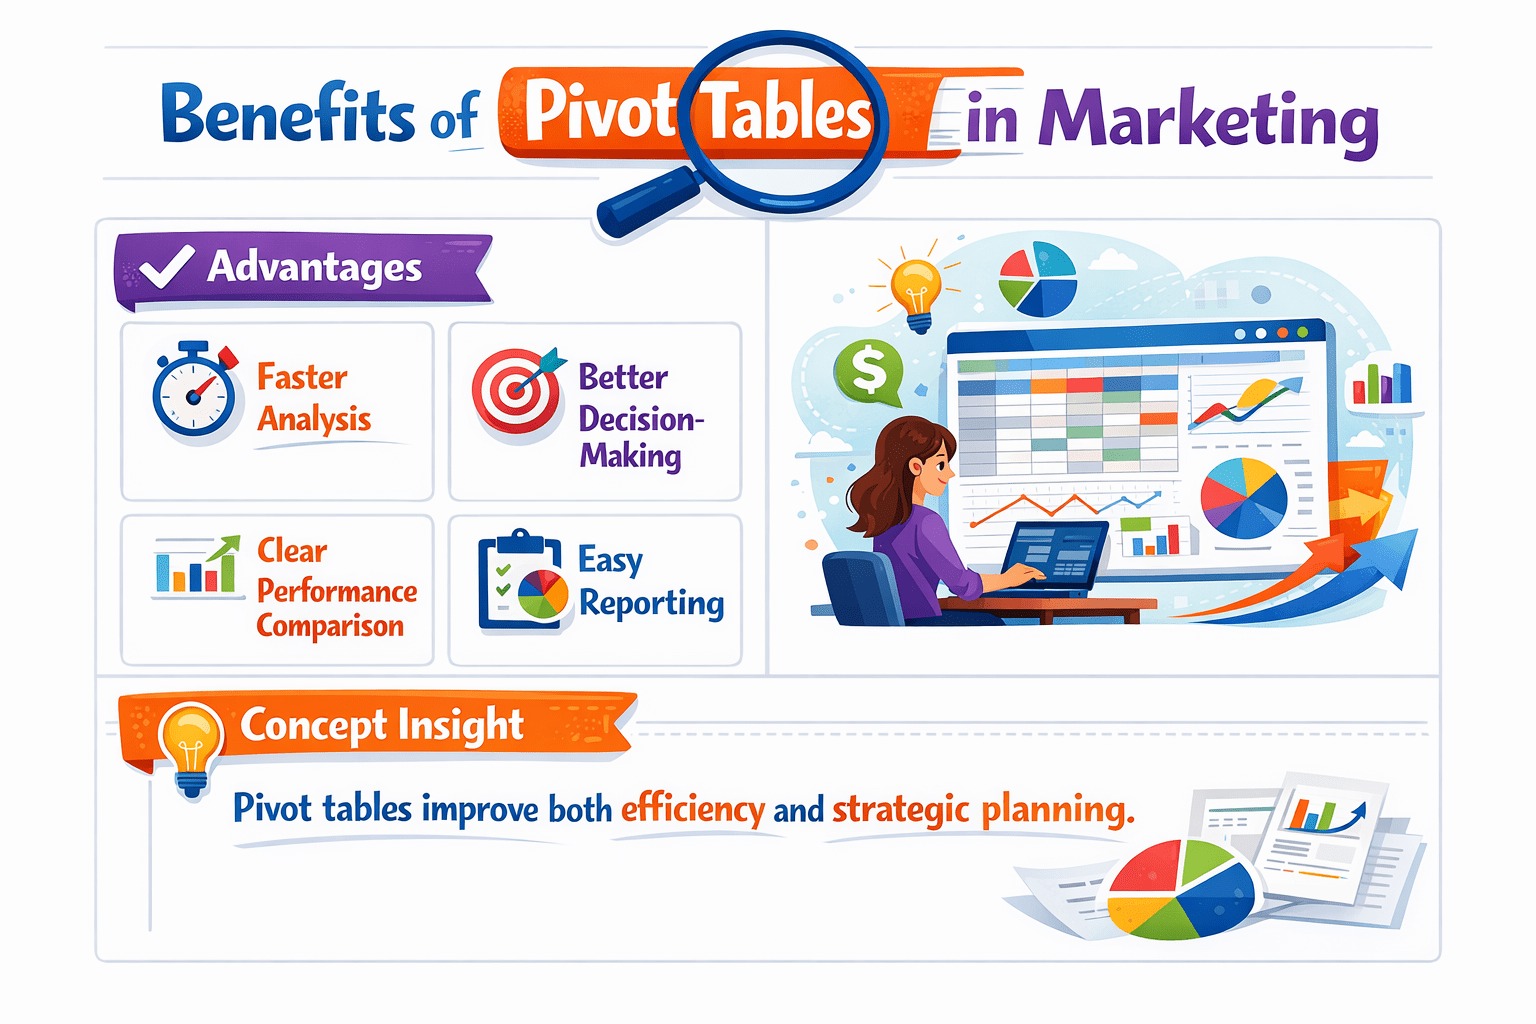
Clear Performance
Comparison
Better Decision
Making
Easy Reporting
Pivot tables improve both efficiency and strategic planning.
Summary
5
Improve reporting and insights
4
Support data-driven marketing decisions
3
Help track key metrics and performance
2
Enable funnel and campaign analysis
1
Pivot tables simplify large datasets
Quiz
Pivot tables are mainly used for:
A. Designing ads
B. Summarizing data
C. Writing code
D. Creating websites

Quiz-Answer

A. Designing ads
Pivot tables are mainly used for:
B. Summarizing data
C. Writing code
D. Creating websites