Demonstrate Understanding of SIEM Architecture Through Real Mapping and Visualization

Business Scenario
Welcome!
You are a Junior SOC Analyst at CyberSecure Solutions. The organization uses a SIEM to collect security data from different systems and generate alerts.
Your task is to identify the main components of the SIEM architecture, map how data flows through the system, and visualize security events on the SIEM dashboard.


Pre-Lab Preparation
Topic : SIEM and Security Frameworks
1) SIEM concepts and architecture
2) Incident response lifecycle
3) MITRE ATT&CK framework overview
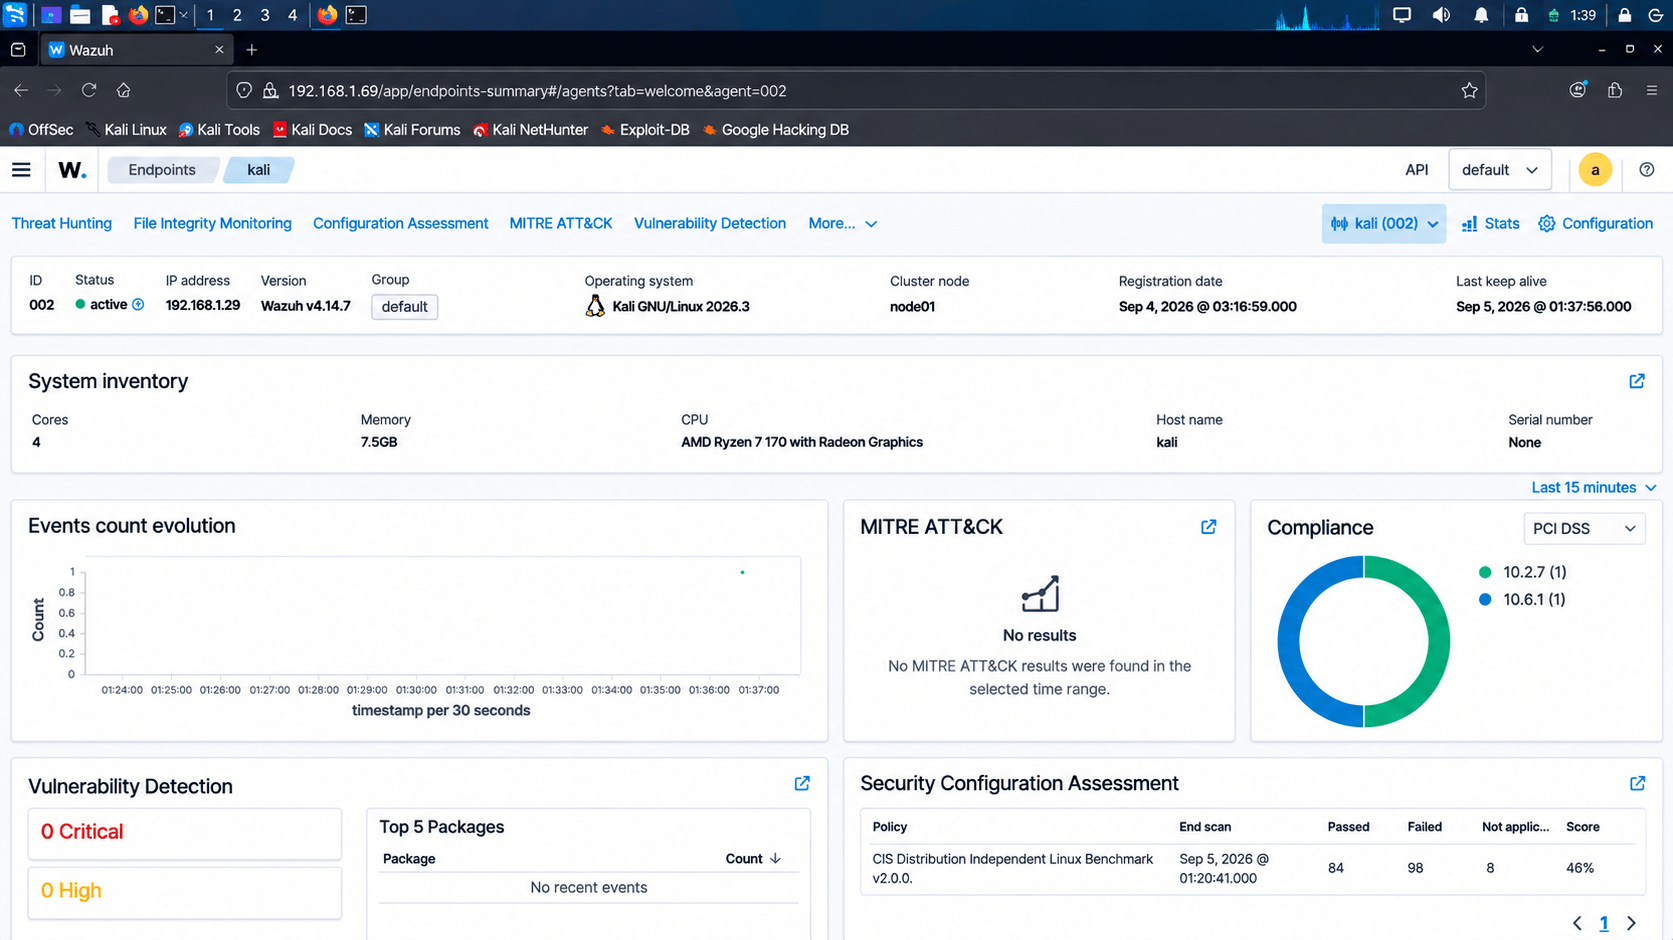
Task 1: Identify SIEM Components
Understand the main components of a SIEM architecture.
1
Steps
a
-
Open the SIEM dashboard.
-
Identify:
-
Log Sources
-
Agent/Collector
-
SIEM Server
-
Rules/Detection Engine
-
Alerts
-
Dashboard
-
-
Record the purpose of each component.
-
Open the SIEM dashboard.
-
Identify:
-
Log Sources
-
Agent/Collector
-
SIEM Server
-
Rules/Detection Engine
-
Alerts
-
Dashboard
-
-
Record the purpose of each component.
Task 2: Map the SIEM Data Flow
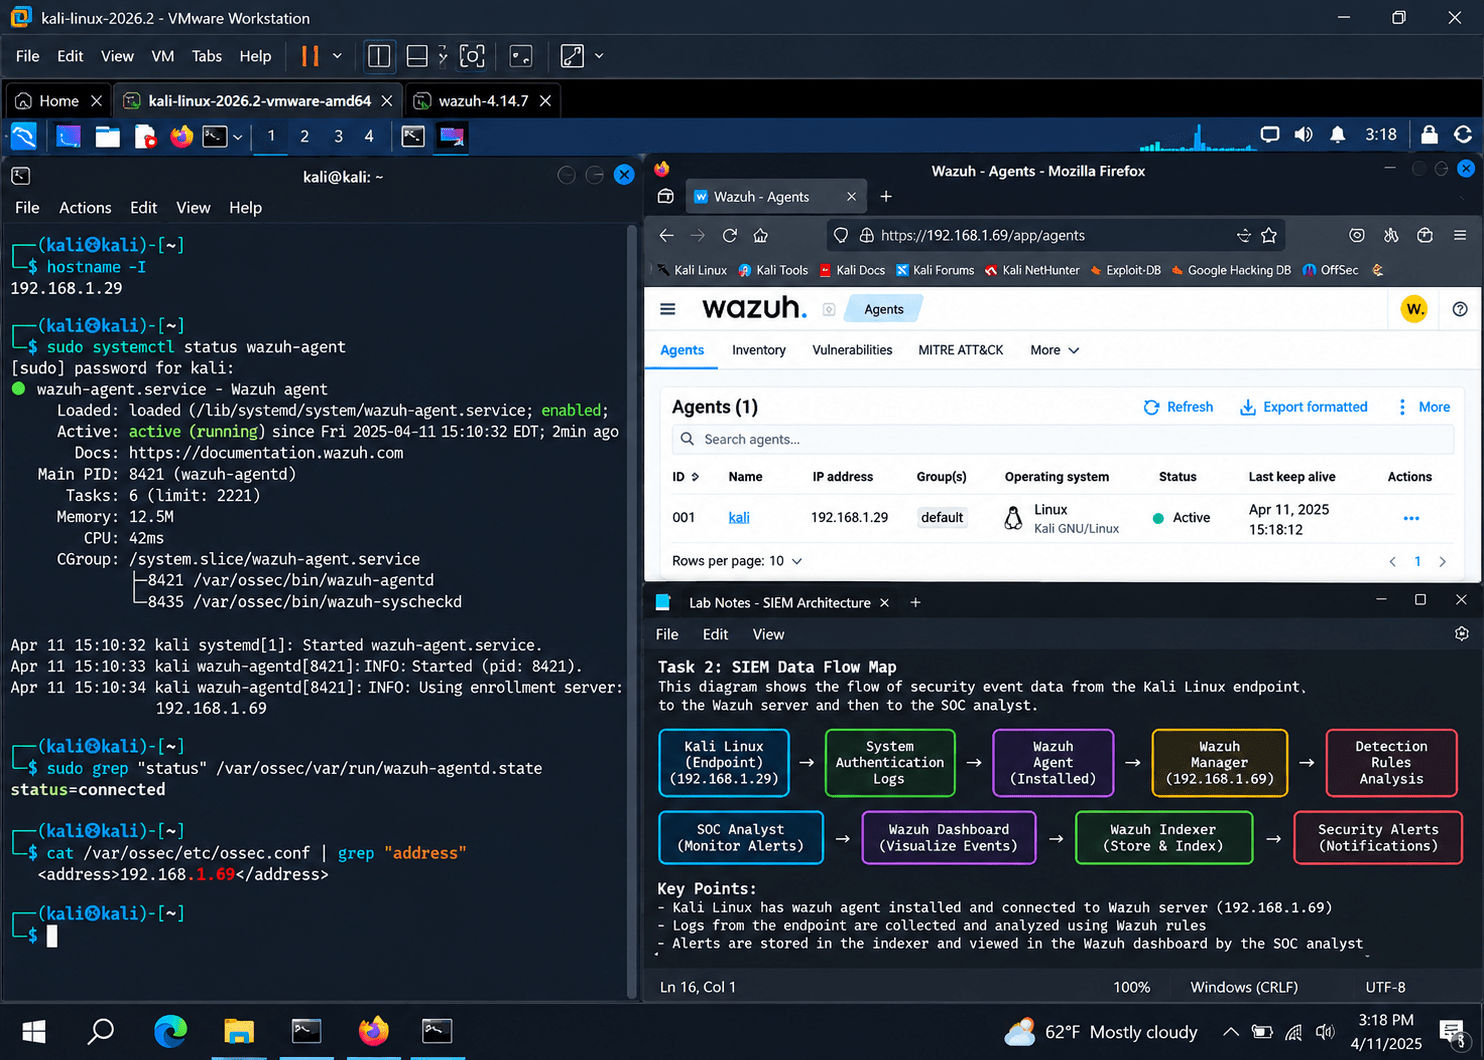
Create a simple architecture map showing how security data reaches the SOC analyst.
1
Steps
a
-
Identify the available log sources.
-
Identify how logs are collected.
-
Identify the SIEM server.
-
Identify where detection rules are applied.
-
Identify where alerts are generated.
-
Draw the complete data flow.
Task 3: Generate and View Security Events
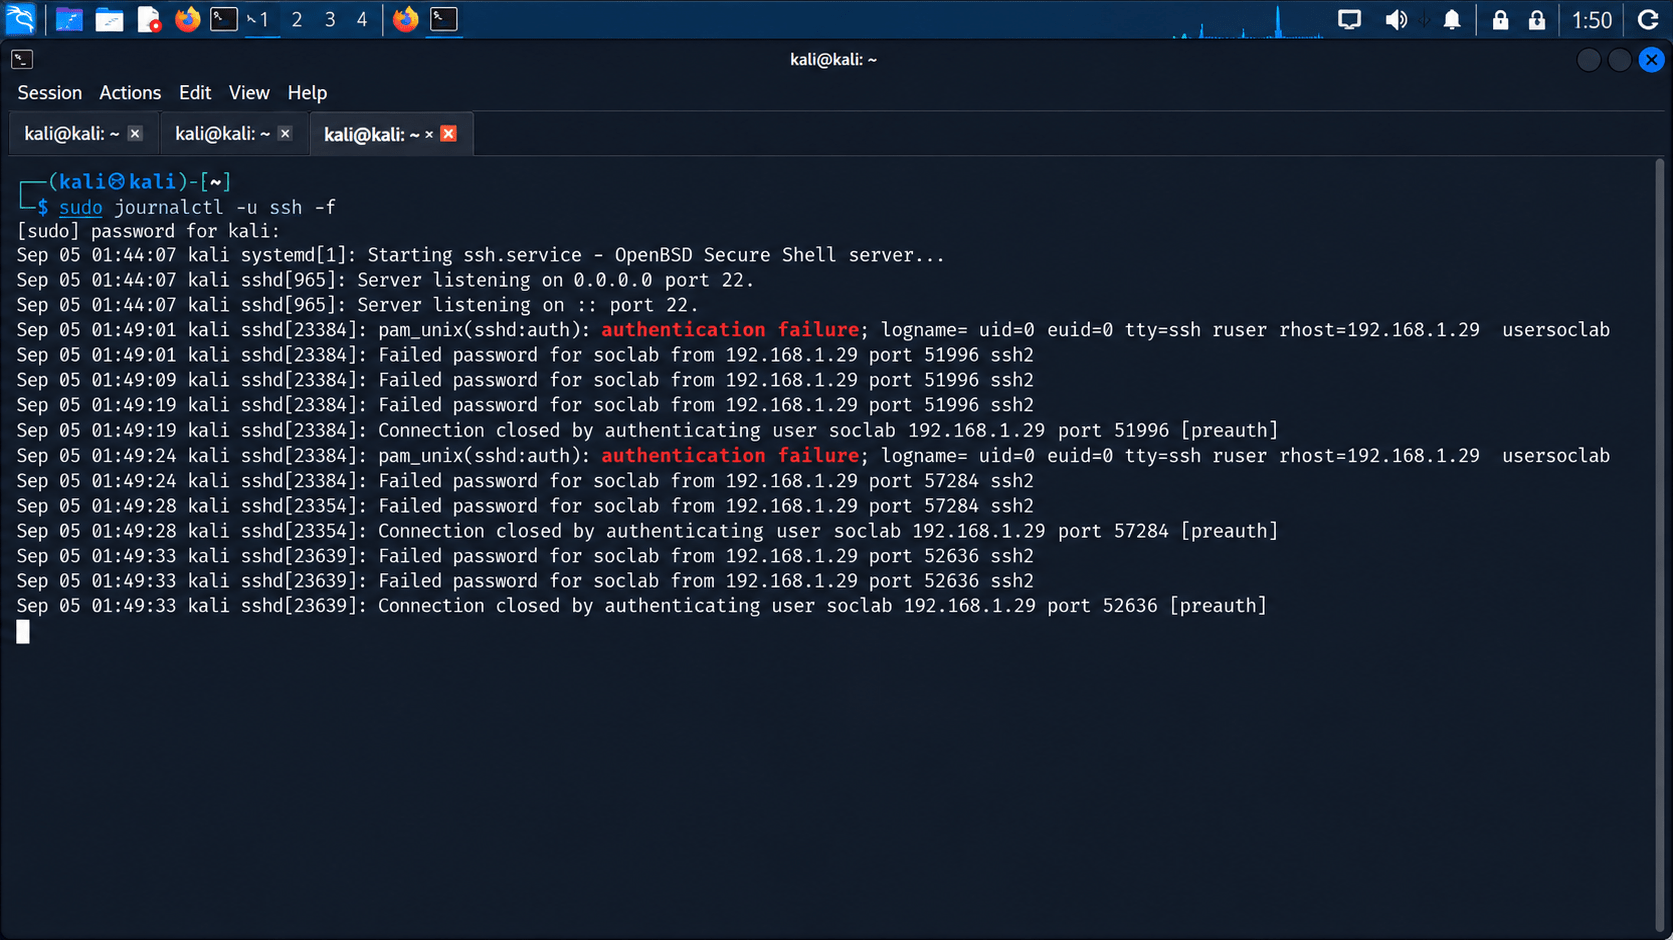
Understand how real events appear inside a SIEM.
1
Steps
a
-
Start the monitored test machine.
-
Generate simple authorized test events, such as:
-
Failed login attempts.
-
Successful login.
-
File creation/deletion.
-
Service changes.
-
-
Open the SIEM dashboard.
-
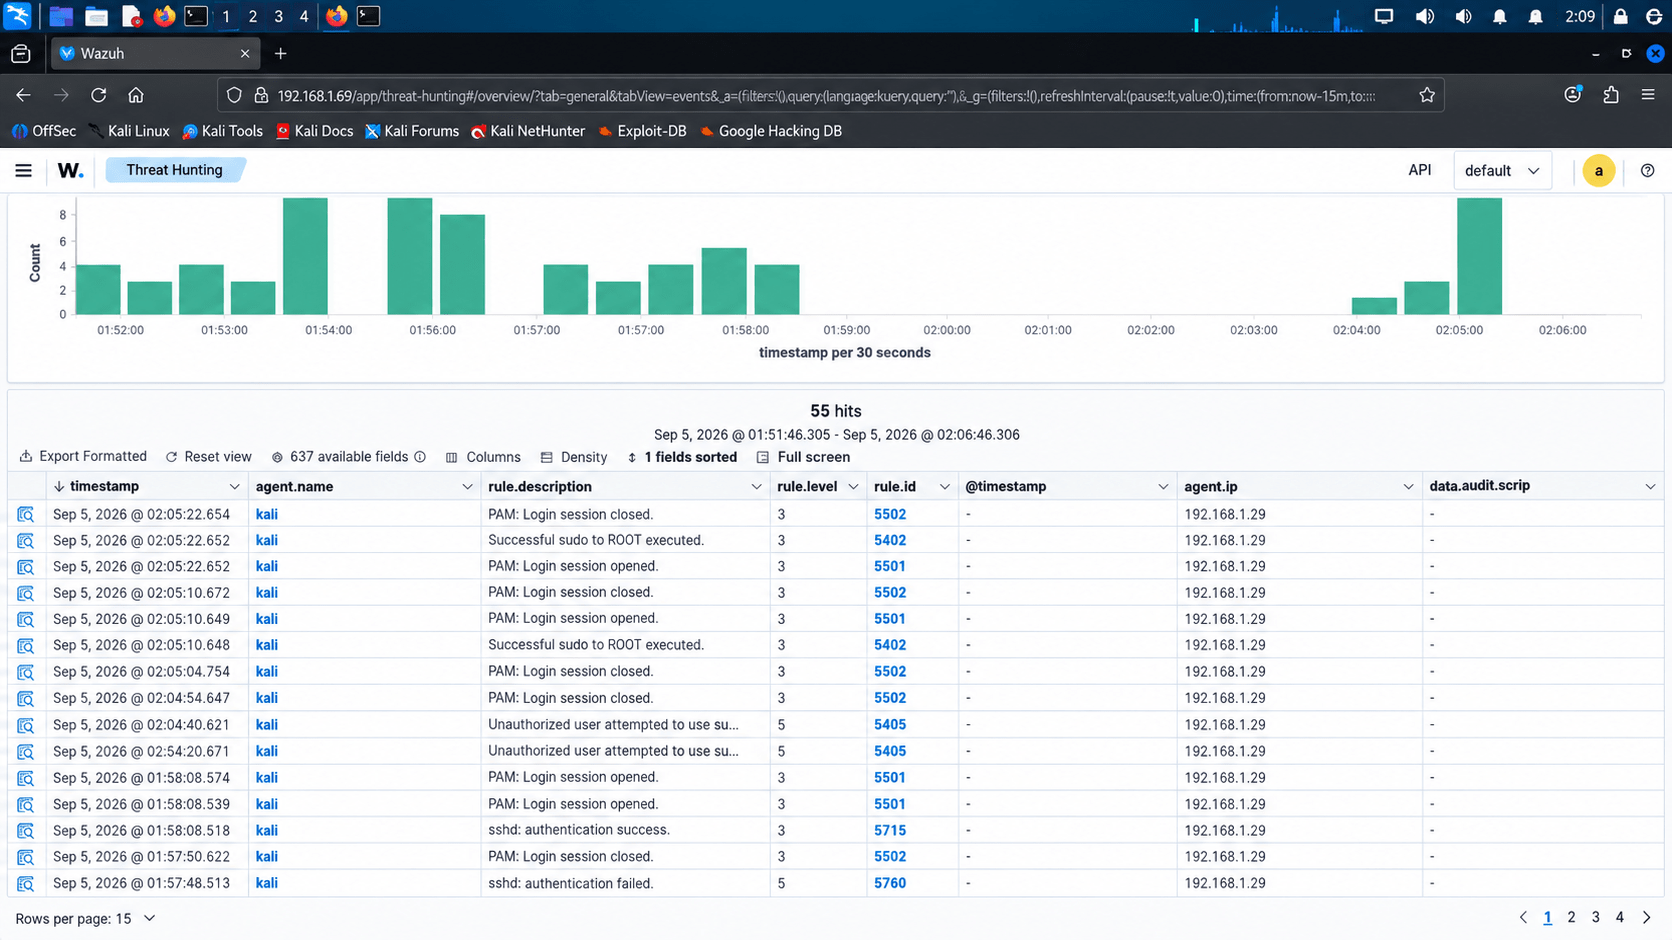
Search for the generated events.
-
Record:
-
Timestamp
-
Source
-
Event type
-
Severity
-
Username
-
Expected Output
b
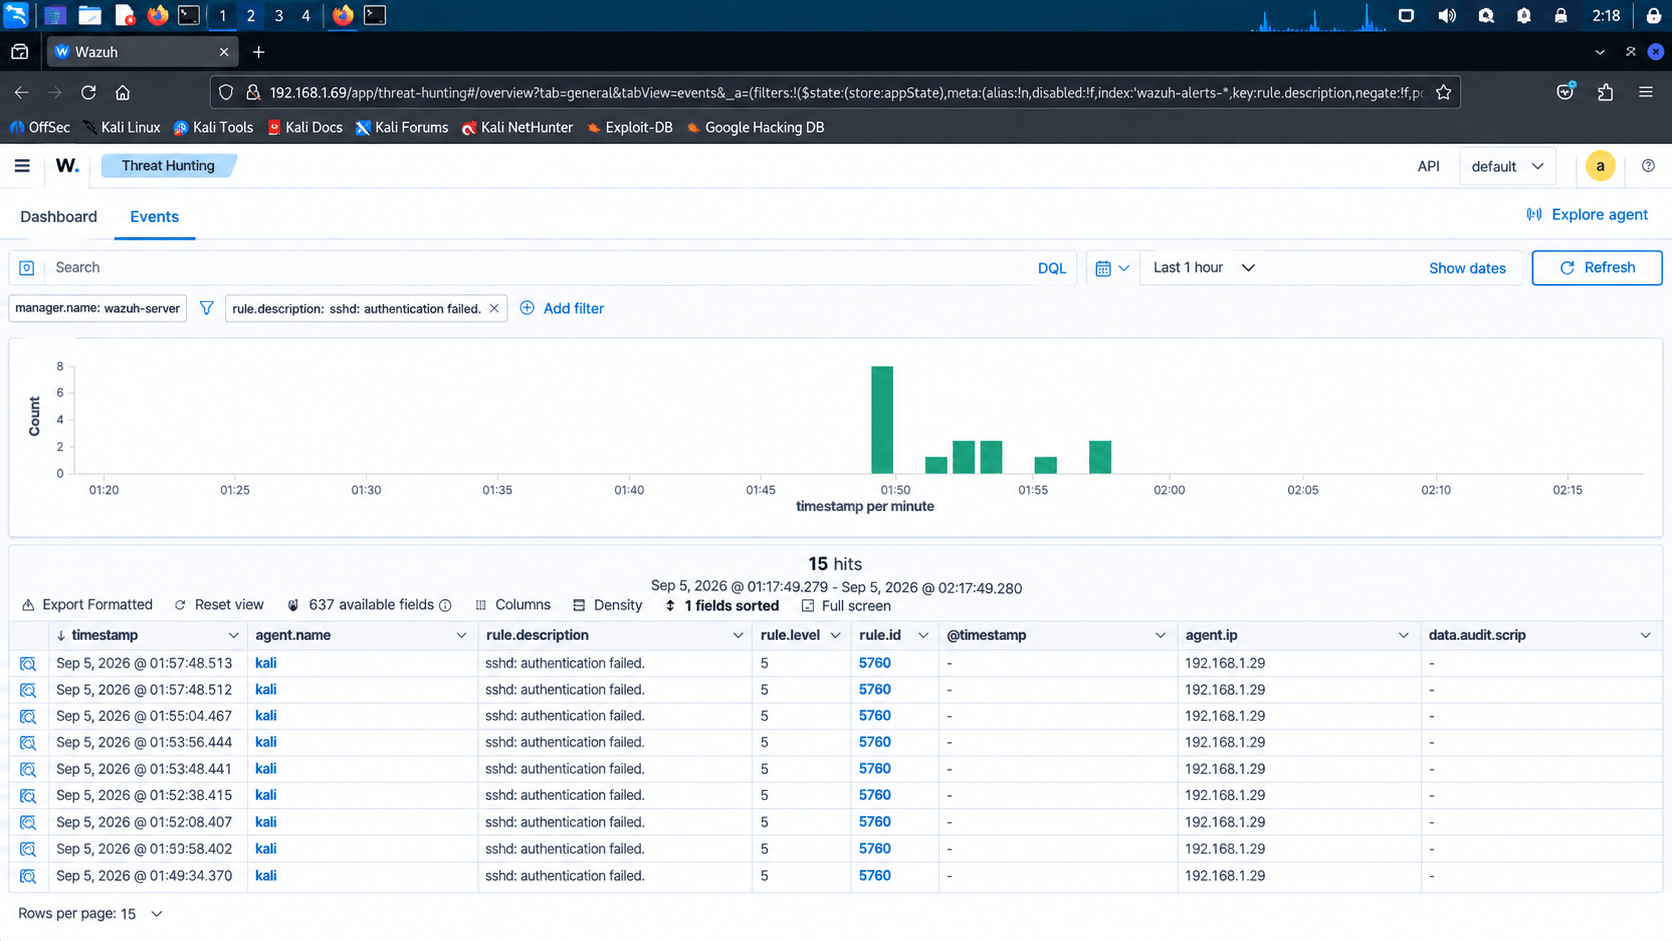
Task 4: Visualize Security Events
Understand how a SIEM presents security information visually.
1
Steps
a
-
Open the SIEM dashboard.
-
View available charts, graphs, or event tables.
-
Identify:
-
Number of alerts
-
Alert severity
-
Top event sources
-
Event types
-
Time of events
-
-
Select one suspicious event.
-
Analyze its details.
-
Open the SIEM dashboard.
-
View available charts, graphs, or event tables.
-
Identify:
-
Number of alerts
-
Alert severity
-
Top event sources
-
Event types
-
Time of events
-
-
Select one suspicious event.
-
Analyze its details.
Task 5: Explain the SOC Workflow
Connect SIEM architecture with the role of a SOC analyst.
1
Steps
a
Explain the following workflow:
Log Collection
↓
SIEM Processing
↓
Detection
↓
Alert
↓
SOC Analyst
↓
Investigation
↓
Response
Explain the following workflow:
Log Collection
↓
SIEM Processing
↓
Detection
↓
Alert
↓
SOC Analyst
↓
Investigation
↓
Response
Task 6: Document the SIEM Architecture
| Component | Purpose |
|---|---|
| Endpoint | Generates security events |
| Log Collector | Collects logs |
| SIEM | Stores and analyzes logs |
| Detection Engine | Identifies suspicious activity |
| Alert | Notifies analysts |
| Dashboard | Visualizes events |
| SOC Analyst | Investigates and responds |
| Component | Purpose |
|---|---|
| Endpoint | Generates security events |
| Log Collector | Collects logs |
| SIEM | Stores and analyzes logs |
| Detection Engine | Identifies suspicious activity |
| Alert | Notifies analysts |
| Dashboard | Visualizes events |
| SOC Analyst | Investigates and responds |
Click to view : SOC incident report
Great job!
You have successfully completed your SIEM Architecture Mapping and Visualization lab.
In this lab, you have: Understood SIEM architecture, Mapped SIEM components, Visualized data flow, Identified key monitoring stages
You are now ready to move to the next stage of SIEM monitoring and analysis.
Checkpoint
Next-Lab Preparation
Topic : SIEM and Security Frameworks
1) SIEM concepts and architecture
2) Incident response lifecycle
3) MITRE ATT&CK framework overview
Topic : SIEM and Security Frameworks
1) SIEM concepts and architecture
2) Incident response lifecycle
3) MITRE ATT&CK framework overview